
by Calculated Risk on 3/27/2024 09:41:00 AM
Today, in the Calculated Risk Real Estate Newsletter: Inflation Adjusted House Prices 2.4% Below Peak
Excerpt:
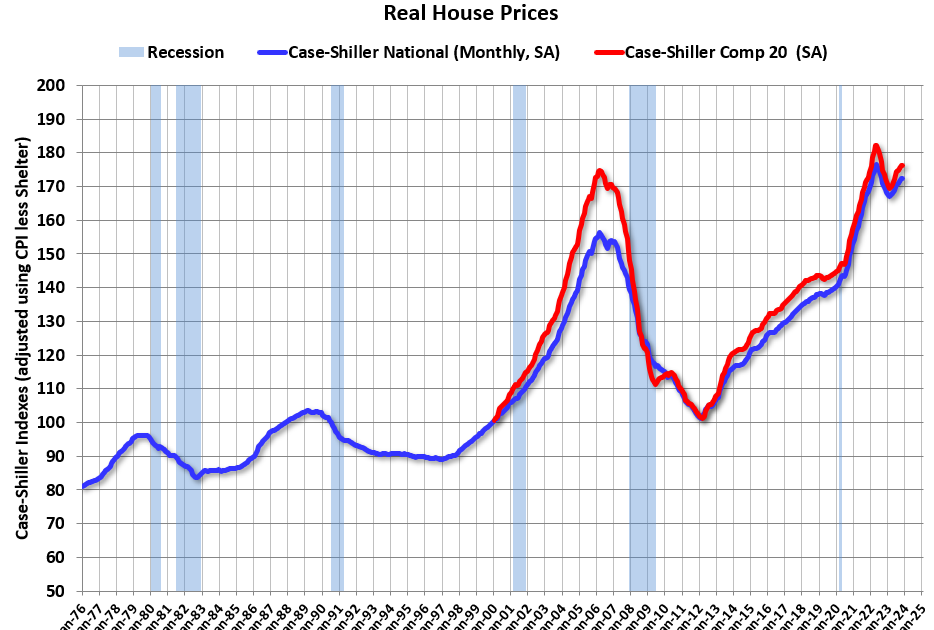
It has been over 17 years since the bubble peak. In the January Case-Shiller house price index released yesterday, the seasonally adjusted National Index (SA), was reported as being 71% above the bubble peak in 2006. However, in real terms, the National index (SA) is about 10% above the bubble peak (and historically there has been an upward slope to real house prices). The composite 20, in real terms, is 1% above the bubble peak.
People usually graph nominal house prices, but it is also important to look at prices in real terms. As an example, if a house price was $300,000 in January 2010, the price would be $427,000 today adjusted for inflation (42% increase). That is why the second graph below is important – this shows “real” prices.
The third graph shows the price-to-rent ratio, and the fourth graph is the affordability index. The last graph shows the 5-year real return based on the Case-Shiller National Index
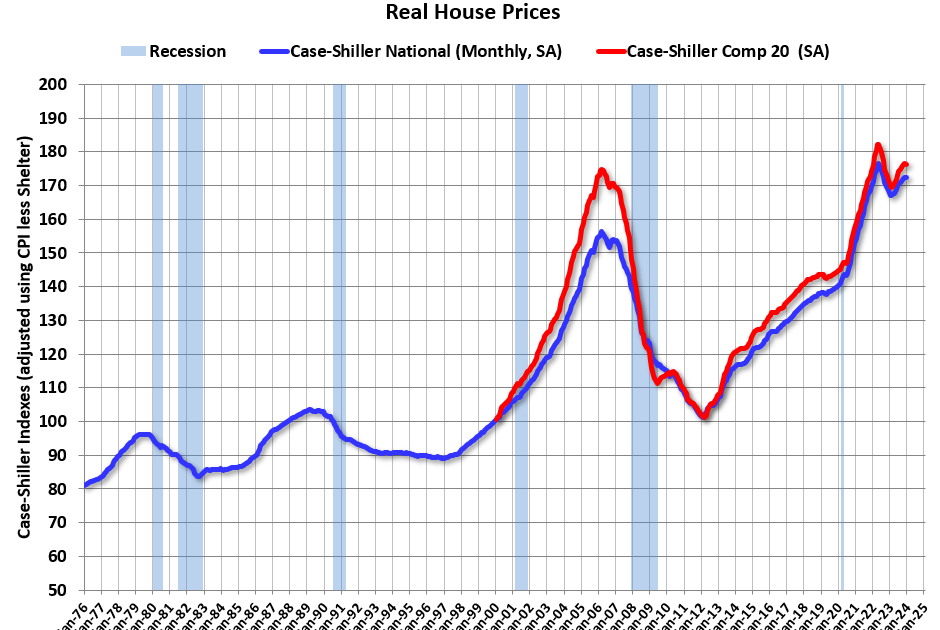
…The second graph shows the same two indexes in real terms (adjusted for inflation using CPI).
In real terms (using CPI), the National index is 2.4% below the recent peak, and the Composite 20 index is 3.3% below the recent peak in 2022. Both indexes were mostly flat in January in real terms.
In real terms, national house prices are 10.2% above the bubble peak levels. There is an upward slope to real house prices, and it has been over 17 years since the previous peak, but real prices are historically high.

There is much more in the article.
by Calculated Risk on 3/26/2024 01:00:00 PM
Two key points:
1) There is a clear seasonal pattern for house prices.
2) The surge in distressed sales during the housing bust distorted the seasonal pattern. This was because distressed sales (at lower price points) happened at a steady rate all year, while regular sales followed the normal seasonal pattern. This made for larger swings in the seasonal factor during the housing bust.

Click on graph for larger image.
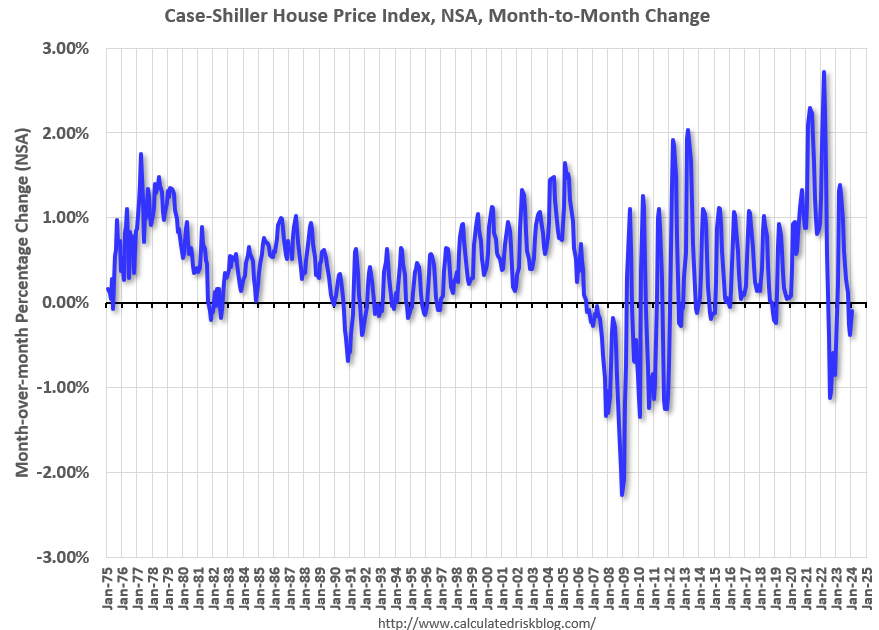
This graph shows the month-to-month change in the NSA Case-Shiller National index since 1987 (through January 2024). The seasonal pattern was smaller back in the ’90s and early ’00s and increased once the bubble burst.
The seasonal swings declined following the bust, however the pandemic price surge changed the month-over-month pattern.
 The second graph shows the seasonal factors for the Case-Shiller National index since 1987. The factors started to change near the peak of the bubble, and really increased during the bust since normal sales followed the regular seasonal pattern – and distressed sales happened all year.
The swings in the seasonal factors were decreasing following the bust but have increased again recently – this time without a surge in distressed sales.
Using the 2018 and 2019 seasonal factors, the Seasonally Adjusted Case-Shiller index would have declined slightly in January instead of increasing 0.4% month-over-month.

by Calculated Risk on 3/26/2024 09:00:00 AM
S&P/Case-Shiller released the monthly Home Price Indices for January (“January” is a 3-month average of November, December and January closing prices).
This release includes prices for 20 individual cities, two composite indices (for 10 cities and 20 cities) and the monthly National index.
From S&P S&P CoreLogic Case-Shiller Index Continues to Trend Upward in January 2024
The S&P CoreLogic Case-Shiller U.S. National Home Price NSA Index, covering all nine U.S. census divisions, reported a 6.0% annual gain in January, up from a 5.6% rise in the previous month. The 10-
City Composite showed an increase of 7.4%, up from a 7.0% increase in the previous month. The 20-
City Composite posted a year-over-year increase of 6.6%, up from a 6.2% increase in the previous
month. San Diego again reported the highest year-over-year gain among the 20 cities with an 11.2%
increase in January, followed by Los Angeles, with an increase of 8.6%. Portland, though holding the
lowest rank after reporting the smallest year-over-year growth, retained an upward trend with a 0.9%
increase this month.
…
The U.S. National Index and the 20-City Composite showed a continued decrease of 0.1%, and 10-City
Composite remained unchanged in January.After seasonal adjustment, the U.S. National Index, the 20-City Composite, and the 10-City Composite
all posted month-over-month increases of 0.4%, 0.1%, and 0.2% respectively.“U.S. home prices continued their drive higher,” says Brian D. Luke, Head of Commodities, Real &
Digital Assets at S&P Dow Jones Indices. “Our National Composite rose by 6% in January, the fastest
annual rate since 2022. Stronger gains came from our 10- and 20-City Composite indices, rising 7.4%
and 6.6%, respectively. For the second consecutive month, all cities reported increases in annual
prices, with San Diego surging 11.2%. On a seasonal adjusted basis, home prices have continued to
break through previous all-time highs set last year”
emphasis added
 Click on graph for larger image.
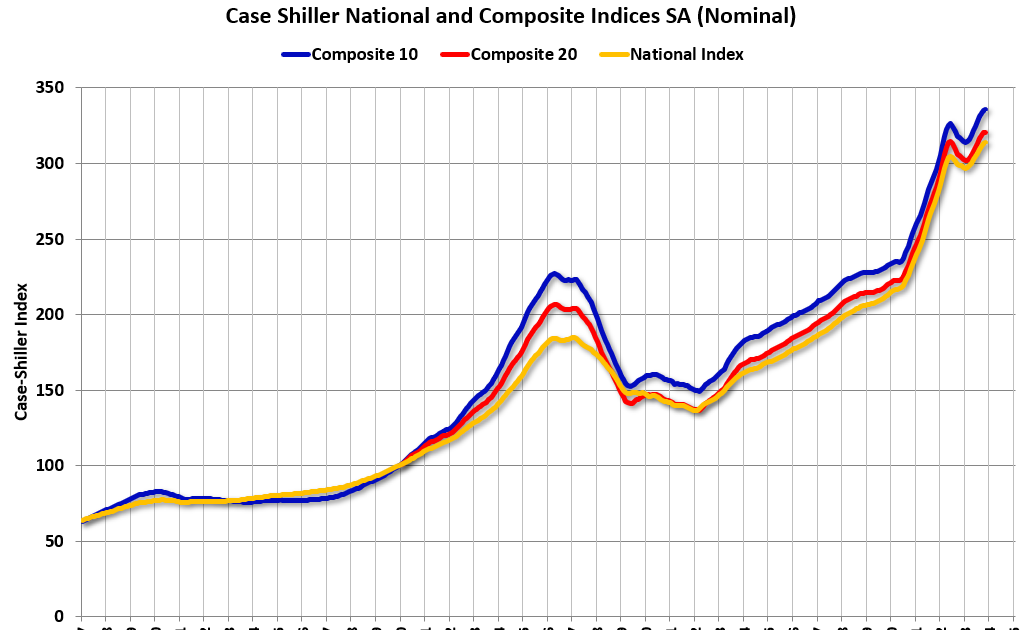
The first graph shows the nominal seasonally adjusted Composite 10, Composite 20 and National indices (the Composite 20 was started in January 2000).
The Composite 10 index is up 0.2% in January (SA). The Composite 20 index is up 0.1% (SA) in January.
The National index is up 0.4% (SA) in January.
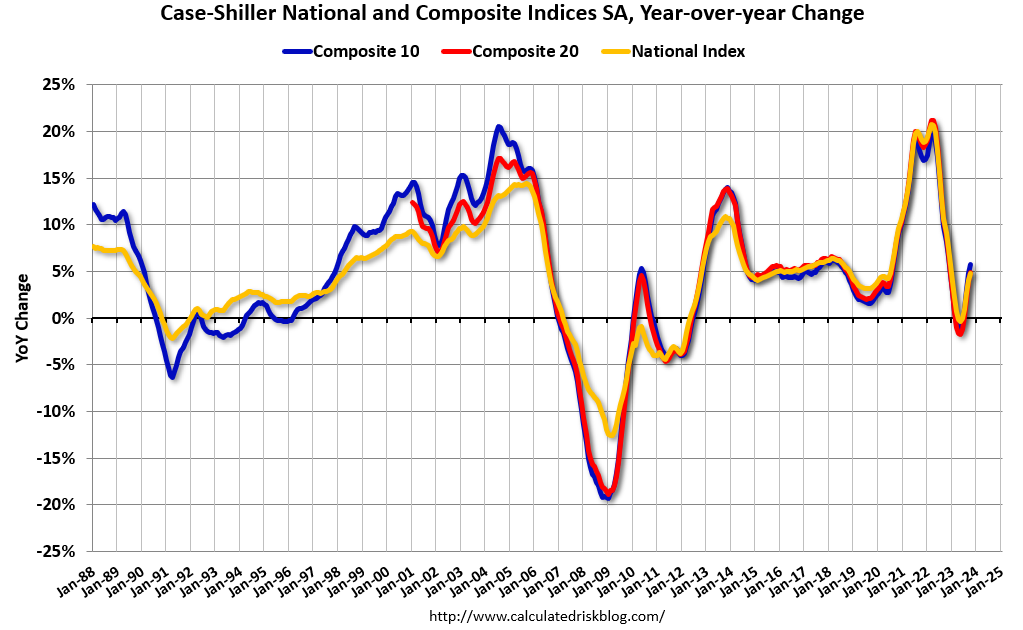
 The second graph shows the year-over-year change in all three indices.
The Composite 10 SA is up 7.4% year-over-year. The Composite 20 SA is up 6.6% year-over-year.
The National index SA is up 6.0% year-over-year.
Annual price changes were at expectations. I’ll have more later.
by Calculated Risk on 3/05/2024 11:41:00 AM
Today, in the Calculated Risk Real Estate Newsletter: Inflation Adjusted House Prices 2.4% Below Peak
Excerpt:
It has been over 17 years since the bubble peak. In the December Case-Shiller house price index released last week, the seasonally adjusted National Index (SA), was reported as being 70% above the bubble peak in 2006. However, in real terms, the National index (SA) is about 10% above the bubble peak (and historically there has been an upward slope to real house prices). The composite 20, in real terms, is 1% above the bubble peak.
People usually graph nominal house prices, but it is also important to look at prices in real terms. As an example, if a house price was $300,000 in January 2010, the price would be $426,000 today adjusted for inflation (42% increase). That is why the second graph below is important – this shows “real” prices.
The third graph shows the price-to-rent ratio, and the fourth graph is the affordability index. The last graph shows the 5-year real return based on the Case-Shiller National Index.
…In real terms (using CPI), the National index is 2.4% below the recent peak, and the Composite 20 index is 3.2% below the recent peak in 2022. Both indexes declined slightly in December in real terms.
In real terms, national house prices are 10.2% above the bubble peak levels. There is an upward slope to real house prices, and it has been over 17 years since the previous peak, but real prices are historically high.
There is much more in the article.
by Calculated Risk on 2/27/2024 09:00:00 AM
S&P/Case-Shiller released the monthly Home Price Indices for December (“December” is a 3-month average of October, November and December closing prices).
This release includes prices for 20 individual cities, two composite indices (for 10 cities and 20 cities) and the monthly National index.
From S&P S&P CoreLogic Case-Shiller Index Reports 5.5% Annual Home Price Gain for Calendar 2023
The S&P CoreLogic Case-Shiller U.S. National Home Price NSA Index, covering all nine U.S. census divisions, reported a 5.5% annual gain in December, up from a 5.0% rise in the previous month. The
10-City Composite showed an increase of 7.0%, up from a 6.3% increase in the previous month. The
20-City Composite posted a year-over-year increase of 6.1%, up from a 5.4% increase in the previous
month. San Diego reported the highest year-over-year gain among the 20 cities with an 8.8% increase
in December, followed by Los Angeles and Detroit, each with an 8.3% increase. Portland showed a
0.3% increase this month, holding the lowest rank after reporting the smallest year-over-year growth.
…
The U.S. National Index showed a continued decrease of 0.4%, while the 20-City Composite and 10-
City Composite posted 0.3% and 0.2% month-over-month decreases respectively in December.After seasonal adjustment, the U.S. National Index, the 20-City Composite, and the 10-City Composite
all posted month-over-month increases of 0.2%.“U.S. home prices faced significant headwinds in the fourth quarter of 2023,” says Brian D. Luke, Head
of Commodities, Real & Digital Assets at S&P Dow Jones Indices. “However, on a seasonally adjusted
basis, the S&P Case-Shiller Home Price Indices continued its streak of seven consecutive record highs
in 2023. Ten of 20 markets beat prior records, with San Diego registering an 8.9% gain and Las Vegas
the fastest rising market in December, after accounting for seasonal impacts.”“2023 U.S. housing gains haven’t followed such a synchronous pattern since the COVID housing boom.
The term ‘a rising tide lifts all boats’ seems appropriate given broad-based performance in the U.S.
housing sector. All 20 markets reported yearly gains for the first time this year, with four markets rising
over 8%. Portland eked out a positive annual gain after 11 months of declines. Regionally, the Midwest
and Northeast both experienced the greatest annual appreciation with 6.7%.”
 Click on graph for larger image.
The first graph shows the nominal seasonally adjusted Composite 10, Composite 20 and National indices (the Composite 20 was started in January 2000).
The Composite 10 index is up 0.2% in December (SA) and is at a new all-time high.
The Composite 20 index is up 0.2% (SA) in December and is also at a new all-time high.
The National index is up 0.2% (SA) in December and is also at a new all-time high.
 The second graph shows the year-over-year change in all three indices.
The Composite 10 SA is up 7.0% year-over-year. The Composite 20 SA is up 6.1% year-over-year.
The National index SA is up 5.5% year-over-year.
Annual price changes were at expectations. I’ll have more later.
by Calculated Risk on 2/04/2024 09:04:00 AM
On Friday, the BEA released their estimate of vehicle sales for January.
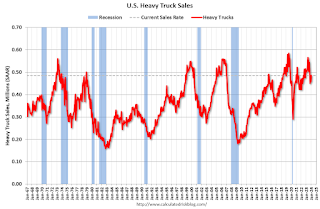
This graph shows heavy truck sales since 1967 using data from the BEA. The dashed line is the January 2024 seasonally adjusted annual sales rate (SAAR).
Heavy truck sales really collapsed during the great recession, falling to a low of 180 thousand SAAR in May 2009. Then heavy truck sales increased to a new record high of 570 thousand SAAR in April 2019.
 Click on graph for larger image.
Note: “Heavy trucks – trucks more than 14,000 pounds gross vehicle weight.”
Heavy truck sales declined sharply at the beginning of the pandemic, falling to a low of 308 thousand SAAR in May 2020.
Heavy truck sales were at 485 thousand SAAR in January, up from 458 thousand in December, and down 3.1% from 501 thousand SAAR in January 2023.
Usually, heavy truck sales decline sharply prior to a recession. Heavy truck sales are solid.
 The second graph shows light vehicle sales since the BEA started keeping data in 1967. Vehicle sales were at 15.00 million SAAR in January, down 6.9% from 16.12 million in December, and down 0.7% from 15.11 million in January 2023.Vehicle sales are usually a transmission mechanism for Federal Open Market Committee (FOMC) policy, although far behind housing. This time vehicle sales were more suppressed by supply chain issues than Fed rate hikes.
by Calculated Risk on 2/01/2024 12:37:00 PM
Today, in the Calculated Risk Real Estate Newsletter: https://calculatedrisk.substack.com/p/inflation-adjusted-house-prices-23-56a
Excerpt:
It has been over 17 years since the bubble peak. In the November Case-Shiller house price index released yesterday, the seasonally adjusted National Index (SA), was reported as being 70% above the bubble peak in 2006. However, in real terms, the National index (SA) is about 10% above the bubble peak (and historically there has been an upward slope to real house prices). The composite 20, in real terms, is 1% above the bubble peak.
People usually graph nominal house prices, but it is also important to look at prices in real terms. As an example, if a house price was $300,000 in January 2010, the price would be $425,000 today adjusted for inflation (41.5% increase). That is why the second graph below is important – this shows “real” prices.
The third graph shows the price-to-rent ratio, and the fourth graph is the affordability index. The last graph shows the 5-year real return based on the Case-Shiller National Index.
…The second graph shows the same two indexes in real terms (adjusted for inflation using CPI).
In real terms (using CPI), the National index is 2.3% below the recent peak, and the Composite 20 index is 3.2% below the recent peak in 2022.
In real terms, national house prices are 10.4% above the bubble peak levels. There is an upward slope to real house prices, and it has been over 17 years since the previous peak, but real prices are historically high.

There is much more in the article.
by Calculated Risk on 1/30/2024 09:00:00 AM
S&P/Case-Shiller released the monthly Home Price Indices for November (“November” is a 3-month average of September, October and November closing prices).
This release includes prices for 20 individual cities, two composite indices (for 10 cities and 20 cities) and the monthly National index.
From S&P S&P CoreLogic Case-Shiller Index Upward Trend Decelerates in November
The S&P CoreLogic Case-Shiller U.S. National Home Price NSA Index, covering all nine U.S. census divisions, reported a 5.1% annual gain in November, up from a 4.7% rise in the previous month. The
10-City Composite showed an increase of 6.2%, up from a 5.7% increase in the previous month. The
20-City Composite posted a year-over-year increase of 5.4%, up from a 4.9% increase in the previous
month. Once again, Detroit reported the highest year-over-year gain among the 20 cities with an 8.2%
increase in November, followed again by San Diego with an 8% increase. For the third month in a row,
Portland fell 0.7% and remained the only city reporting lower prices in November versus a year ago.
…
For the first time since January 2023, the U.S. National Index and 20-City Composite posted 0.2%
month-over-month decreases in November, while the 10-City Composite posted a 0.1% decrease.After seasonal adjustment, the U.S. National Index and the 10-City Composite posted month-overmonth increases of 0.2%, while the 20-City Composite posted a month-over-month increase of 0.1%.
“U.S. home prices edged downward from their all-time high in November,” says Brian D. Luke, Head of
Commodities, Real & Digital Assets at S&P DJI. “The streak of nine monthly gains ended in November,
setting the index back to levels last seen over the summer months. Seattle and San Francisco reported
the largest monthly declines, falling 1.4% and 1.3%, respectively.”“November’s year-over-year gain saw the largest growth in U.S. home prices in 2023, with our National
Composite rising 5.1% and the 10-city index rising 6.2%. Detroit held its position as the best performing
market for the third month in a row, accelerating to an 8.2% gain. San Diego notched an 8% annual
gain, retaining its second spot in the nation. Barring a late surge from another market, those cities will
vie for the ‘housing market of the year’ as the best performing city in our composite.”“Six cities registered a new all-time high in November (Miami, Tampa, Atlanta, Charlotte, New York,
and Cleveland). Portland remains the lone market in annual decline. The Northeast and Midwest
recorded the largest gains with returns of 6.4% and 6.3%, respectively. Other regions are not far behind
with the slowest gains in the West of 3%. This month’s report revealed the narrowest spread of
performance across the nation since the first quarter of 2021.”
 Click on graph for larger image.
The first graph shows the nominal seasonally adjusted Composite 10, Composite 20 and National indices (the Composite 20 was started in January 2000).
The Composite 10 index is up 0.2% in November (SA) and is at a new all-time high.
The Composite 20 index is up 0.1% (SA) in November and is also at a new all-time high.
The National index is up 0.2% (SA) in November and is also at a new all-time high.
 The second graph shows the year-over-year change in all three indices.
The Composite 10 SA is up 6.2% year-over-year. The Composite 20 SA is up 5.4% year-over-year.
The National index SA is up 5.1% year-over-year.
Annual price changes were below expectations. I’ll have more later.
by Calculated Risk on 1/27/2024 08:11:00 AM
The key reports scheduled for this week are the January employment report and November Case-Shiller house prices.
Other key indicators include the January ISM manufacturing index and January vehicle sales.
The FOMC meets this week, and no change to policy is expected.
—– Monday, January 29th —–
10:30 AM: Dallas Fed Survey of Manufacturing Activity for January. This is the last of the regional Fed manufacturing surveys for January.
—– Tuesday, January 30th —–
9:00 AM: FHFA House Price Index for November. This was originally a GSE only repeat sales, however there is also an expanded index.
 9:00 AM ET: S&P/Case-Shiller House Price Index for November.
This graph shows the Year over year change in the nominal seasonally adjusted National Index, Composite 10 and Composite 20 indexes through the most recent report (the Composite 20 was started in January 2000).
The consensus is for a 5.8% year-over-year increase.
 10:00 AM ET: Job Openings and Labor Turnover Survey for December from the BLS.
This graph shows job openings (black line), hires (purple), Layoff, Discharges and other (red column), and Quits (light blue column) from the JOLTS.
Jobs openings decreased in November to 8.79 million from 8.85 million in October.
10:00 AM: The Q4 Housing Vacancies and Homeownership report from the Census Bureau.
—– Wednesday, January 31st —–
7:00 AM ET: The Mortgage Bankers Association (MBA) will release the results for the mortgage purchase applications index.
8:15 AM: The ADP Employment Report for January. This report is for private payrolls only (no government). The consensus is for 130,000 payroll jobs added in January, down from 164,000 added in December.
9:45 AM: Chicago Purchasing Managers Index for January. The consensus is for a reading of 48.0, up from 46.9 in December.
2:00 PM: FOMC Meeting Announcement. No change to policy is expected.
2:30 PM: Fed Chair Jerome Powell holds a press briefing following the FOMC announcement.
—– Thursday, February 1st —–
8:30 AM: The initial weekly unemployment claims report will be released. The consensus is for 210 thousand initial claims, down from 214 thousand last week.
10:00 AM: Construction Spending for December. The consensus is for a 0.5% increase in construction spending.
10:00 AM: ISM Manufacturing Index for January. The consensus is for the ISM to be at 47.3, down from 47.4 in December.
—– Friday, February 2nd —–
 8:30 AM: Employment Report for December. The consensus is for 162,000 jobs added, and for the unemployment rate to increase to 3.8%.
There were 216,000 jobs added in December, and the unemployment rate was at 3.7%.
This graph shows the jobs added per month since January 2021.
10:00 AM: University of Michigan’s Consumer sentiment index (Preliminary for January).
 All day: Light vehicle sales for January. Sales were at 15.8 million in December (Seasonally Adjusted Annual Rate).
This graph shows light vehicle sales since the BEA started keeping data in 1967. The dashed line is the December sales rate.
by Calculated Risk on 1/02/2024 12:25:00 PM
Today, in the Real Estate Newsletter: Question #9 for 2024: What will happen with house prices in 2024?
Brief excerpt:
Earlier I posted some questions on my blog for next year: Ten Economic Questions for 2024. Some of these questions concern real estate (inventory, house prices, housing starts, new home sales), and I’ll post thoughts on those in the newsletter (others like GDP and employment will be on my blog).
I’m adding some thoughts, and maybe some predictions for each question.
…
9) House Prices: It appears house prices – as measured by the national repeat sales index (Case-Shiller, FHFA, and Freddie Mac) – will be up mid-single digits in 2023. What will happen with house prices in 2024?The first question I’m always asked is “What will happen with house prices?” No one has a crystal ball, and it depends on supply and demand.
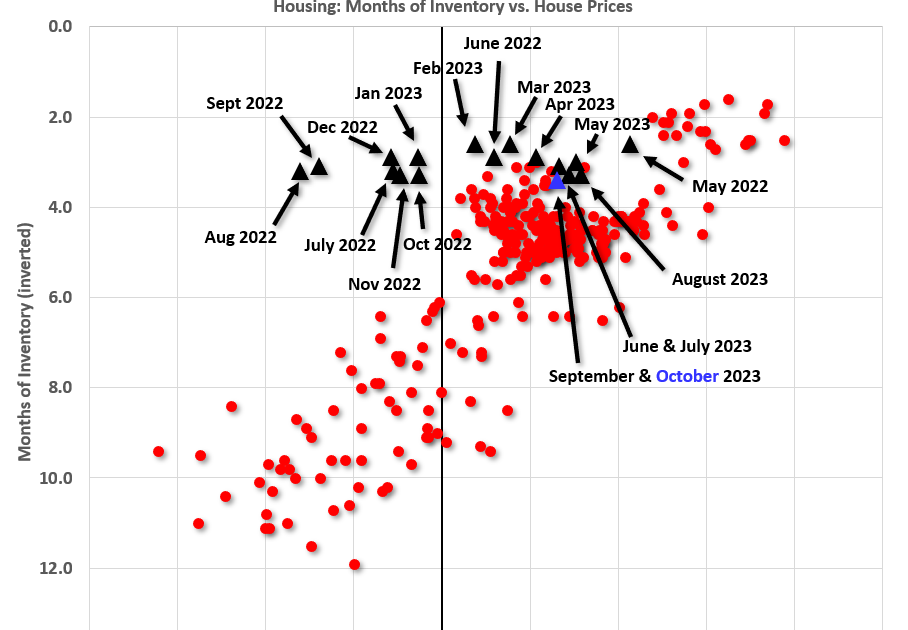
…This graph below shows existing home months-of-supply, inverted, from the National Association of Realtors® (NAR) vs. the seasonally adjusted month-to-month price change in the Case-Shiller National Index (both since January 1999 through October 2023). Note that the months-of-supply is not seasonally adjusted.
The recent months are in black (Oct 2023 in Blue) showing the impact of the initial surge in inventory in 2022 and prices fell for seven months with low levels of inventory!
The last several months are following the historic pattern.
In October, the months-of-supply was at 3.6 months, and the Case-Shiller National Index (SA) increased 0.65% month-over-month.
I don’t expect inventory to reach 2019 levels but based on the recent increase in inventory maybe more than half the gap between 2019 and 2023 levels will close in 2024. If existing home sales remain sluggish, we could see months-of-supply back to 2017 – 2019 levels.

There is much more in the article.