

BEIJING, April 19, 2024 /PRNewswire/ — A report from People’s Daily: The number of German companies in Taicang, east China’s Jiangsu province reached 500 as Beumer Group settled there earlier this year.
During the past three decades, Taicang has consistently seized business opportunities with the German companies based there and created an optimal business environment for them and its successes have been recognized by the authorities in both countries.
In November 2008, Taicang was named a “Sino-German Enterprise Cooperation Base” by China’s Ministry of Commerce and by Germany’s Federal Ministry for Economic Cooperation and Development and remains the only city to be recognized that way by both sides.
Why can this county-level city attract numerous German companies to settle and thrive there?
The sound business environment and professional services that Taicang offers are one of the secrets to the city’s appeal. “Meticulous government services” and “unimpeded communication between the government and enterprises” are the most frequently mentioned terms by German enterprises in Taicang when they speak of the city’s business climate.
Jan Assmann, general manager of the Taicang company of Bernstein, a leading supplier of industrial safety and enclosure technology from Germany, has been living in Taicang for nearly 20 years. He told People’s Daily that the government of Taicang has provided abundant favorable policies for German enterprises and the business environment there is getting better and better.
He believes German companies flocking to Taicang has created a cluster effect. For example, automotive parts manufacturers settling in the city have attracted machine tool manufacturers, which then attracted mold manufacturers. In this way, Taicang has gradually established an industrial chain and supply chain centered around automotive parts and machine tools, Assmann said.
The German Center Taicang was set up in the city in 2016, which provides one-stop business services for nearly 50 enterprises including those from Germany.
“We were attracted by Taicang’s excellent business environment and the professional services provided by the government,” said general manager of the center Marieke Bossek.
According to Bossek, Taicang High-tech Industrial Development Zone has assigned a service specialist to every German enterprise, who the enterprises can turn to for assistance whenever they encounter difficulties or challenges.
“This efficient service has left a deep impression on me,” she said.
In recent years, German companies in Taicang have strengthened their localization strategies, which not only advanced their own development, but also helped with the standardized and massive production of local enterprises. The rapid development of local suppliers has helped German companies reduce production costs and improve supply chain efficiency.
Chiron Group, a leading manufacturer of high-speed CNC machine tools, is considered an “hidden champion” in this industry. The group set up a factory in Taicang in 2012 and later moved its China headquarters to the city, said Willi Riester, chief technology officer of Chiron Machine Tool (Taicang) Co., Ltd.
“Our machine tools require extremely high precision, and it is essential to maintain close communication with both upstream and downstream customers. Thanks to the cluster effect of the China–Germany industrial parks in Taicang, the supply chain here is stable, allowing us to conveniently and swiftly obtain high-quality components,” Riester said.
Currently, over half of the German companies in Taicang place R&D locally, and over 90 percent of the early settlers have completed capital increases and expanded production. The average output value per mu (about 667 square meters) of German companies has reached 14 million yuan ($1.93 million).
At the end of 2023, the New Energy Phase II Factory of a manufacturing base of German manufacturer of rolling element bearings Schaeffler Group was officially inaugurated.
Matthias Zink, CEO Automotive Technologies of Schaeffler Group, noted that the group has expanded its investment in Taicang 13 times, which totaled over 11 billion yuan. Taicang has become one of the group’s largest manufacturing bases globally, Zink added.
Over the past 30 years of cooperation with Germany, the local government of Taicang has paid more and more emphasis to the exchange between Chinese and German cultures, providing a comfortable, well-built, and convenient business and living environment for German companies and their employees.
For instance, Taicang has built a Rothenburg Street, where German bakeries and restaurants can be found almost everywhere.
“The cityscape of Taicang is constantly improving, and the environment has become more beautiful,” Assmann said. “When I’m free, I often take a stroll with my family along the Haiyundi Road and the Rothenburg Street.”
Taicang also hosts events such as beer festivals, marathon races, Sino-German artist salons, and Sino-German table tennis tournaments on a regular basis. It has built service facilities like a Sino-German friendship kindergarten, attracting an increasing number of Germans to settle there.
A series of policies that China released recently have signaled the country’s determination to expand high-level opening-up. It has rolled out five new measures to simplify the process for foreign nationals seeking to visit China, revised the national version of negative list for foreign investment, and lifted all restrictions on foreign investment access to manufacturing.
It also put forward 24 specific measures to further optimize the foreign investment environment and intensify efforts to attract investment, and made continuous efforts to build a market-oriented and world-class business environment governed by a sound legal framework. These efforts are welcomed by German companies in China.
A recent report released by the German Institute for Economic Research showed that direct investment from Germany to China increased by 4.3 percent in 2023, reaching a record high of 11.9 billion euros ($12.79 billion).
Another report released by the German Chamber of Commerce in China earlier this year highlighted that over 90 percent of surveyed companies plan to continue their business operations in China, with 54 percent of them intending to increase their investments in the country.
“Since settling in Taicang in 2004, OASE has seen a continuous increase in actual investment,” said Shen Ya, general manager of Oase Living Water (Taicang) Co., Ltd.
“Over the past three years, our business has grown at an average annual speed of 30 percent. In the future, the group will continue to seize opportunities in China, increase investment in China, and deepen our presence in the Chinese market,” Shen added.
“China’s commitment to expanding high-level opening-up has strong appeal to foreign-invested enterprises. As global economic recovery remains sluggish, China’s economy has shown a positive growth momentum. We hope that more German companies can seize the opportunity and continue to invest in China,” Assmann said.
Photo – https://mma.prnewswire.com/media/2391950/1.jpg
Photo – https://mma.prnewswire.com/media/2391951/2.jpg

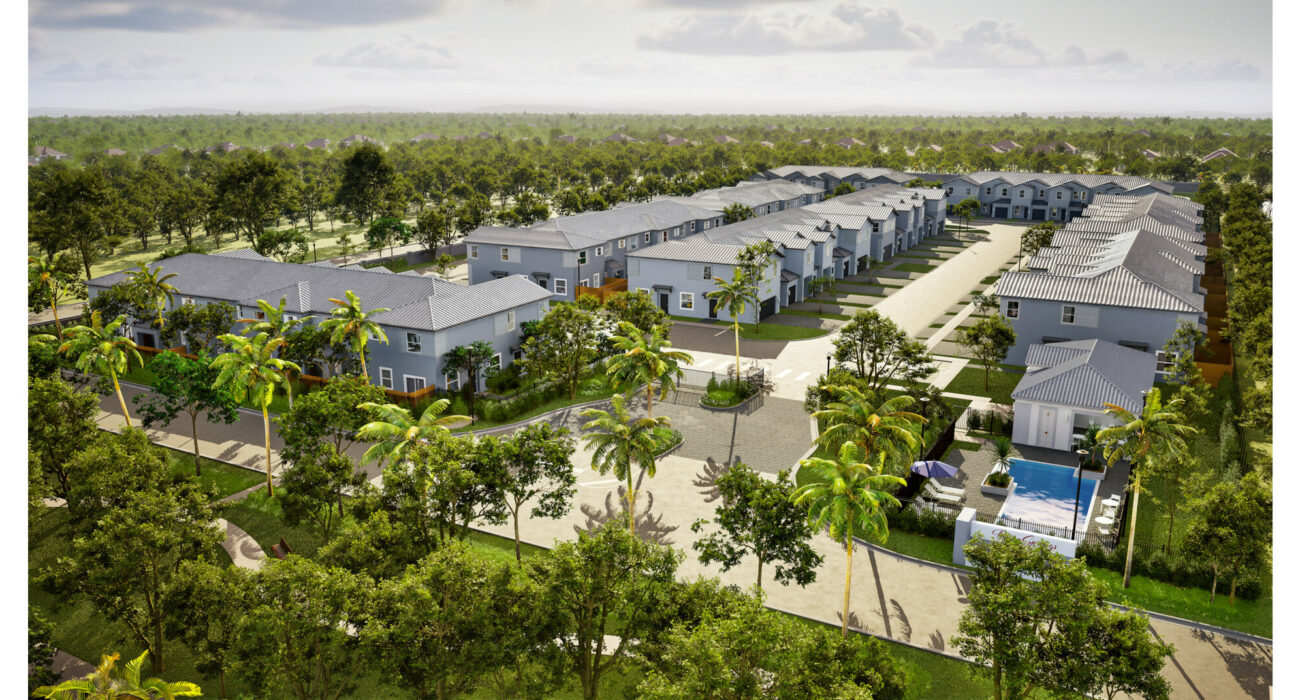
PEMBROKE PINES, Fla., April 18, 2024 /PRNewswire/ — Lennar, one of the nation’s leading homebuilders, announced the debut of Tuscan Springs, a new townhome community offering elegant exteriors and a host of amenities allowing homeowners to enjoy the community to its fullest.
Tuscan Springs offers five well thought-out two-story townhome designs with spacious open concept floorplans ranging from 1,455 to 1,828 square feet of living areas, with three to four bedrooms, two-and-a-half baths, a convenient two-car garage and a fenced rear patio for outdoor enjoyment. Homeowners will enjoy access to an onsite pavilion with a swimming pool and sundeck area, lush park with walking paths, and a convenient mail kiosk all in one convenient location, just steps from their new home. These new townhomes start in the mid $600,000s.
“Life at Tuscan Springs will feel like you’re always on vacation, located in a highly sought-after neighborhood just a short drive away from spectacular shopping and dining venues, and near South Florida’s best beaches and beautiful national parks ,” said Phil Serrate, Division President for Lennar Southeast Florida” This is an exciting opportunity for homebuyers to enjoy a fresh start in a brand-new neighborhood,”
Every home offers Lennar’s signature Everything’s Included® program, where the homebuilder’s most popular options and upgrades are built into the base price of the home. At Tuscan Springs, this includes easy-care mica countertops, stainless-steel appliances and a host of other carefully curated interior touches and designer fixtures.
Home to many top rated schools, Pembroke Pines is recognized as “#1 in Florida as Best Place to Raise Your Kids.” Homeowners at Tuscan Springs will enjoy the benefits of easy access to South Florida’s Turnpike, and endless potential for recreation and excitement at Hollywood Beach, the 299-acre C.B. Smith Park, Seminole Hard Rock Hotel and Casino, as well as numerous shopping and dining destinations.
For more information on these new home opportunities, call 855-865-011 or visit www.lennar.com/new-homes/florida/ft-lauderdale/pembroke-pines.
About Lennar Corporation
Lennar Corporation, founded in 1954, is one of the nation’s leading builders of quality homes for all generations. Lennar builds affordable, move-up and active adult homes primarily under the Lennar brand name. Lennar’s Financial Services segment provides mortgage financing, title and closing services primarily for buyers of Lennar’s homes and, through LMF Commercial, originates mortgage loans secured primarily by commercial real estate properties throughout the United States. Lennar’s Multifamily segment is a nationwide developer of high-quality multifamily rental properties. LENX drives Lennar’s technology, innovation and strategic investments. For more information about Lennar, please visit lennar.com.
Contact: Danielle Tocco
Vice President Communications
Lennar Corporation
[email protected]
Direct Line: 949.789.1633
SOURCE Lennar Corporation


PHOENIX, April 13, 2024 /PRNewswire/ — The residential real estate investment industry is experiencing a major shakeup across the country, as the short list of industry giants who have controlled the market for the last 15 years are suffering massive employee exodus due to poor management, outdated sales tactics and ambitions of a big cashout payday.
“With modern times comes modern expectations. Investment real estate professionals no longer want to work for organizations whose executives or board of directors have their sights set on selling the company out to Wall Street or a VC fund. They’re looking for long term pathways that will enable them to fulfill their entrepreneurial desires, while still being connected to something greater where they have input and control,” said Trey Watson, Founder and CEO at Aurumys. “Building a company with the primary goal of selling out is a poison pill that swiftly rots your culture and confuses priorities, which will ultimately bring even the greatest organizations to their knees. You can’t serve the people if you answer to a board in this particular industry. It’s about the people first”.
Aurumys is an investment real estate brokerage that operates a private marketplace where real estate investors and homeowners buy and sell investment properties. The company’s primary focus is developing top tier talent within their team, which Aurumys believes directly translates to a premium and tailored experience for their investor and homeowner customers. “You can have the best proprietary tech in the world, but if you don’t have great people and you don’t invest in your inner organization, real estate investors will see right through you and you’ll fail your homeowner customers,” claims Trey. The leadership team at Aurumys brings decades of high frequency transactional experience to the table, having climbed the ladders of the industry’s top firms.
In less than 1 year, Aurumys has expanded to 6 states and over 80 employees, with brick-and-mortar offices in Phoenix, Denver, Indianapolis, Albuquerque, Austin and Fort Lauderdale. The company plans to open at least 3 more offices in 2024, and to have 16 operational offices by the end of 2025. Its headquarters is based in Phoenix, Arizona.
For more information visit www.Aurumys.com or call 602-975-1822.
About Aurumys
Pronounced ARE – UMM – ISS.
Aurumys is a residential real estate investment brokerage that operates a private marketplace for real estate investors and homeowners, enabling them to buy and sell investment grade property efficiently. The core customers Aurumys aims to work with are typically mom and pop real estate investors or small partnerships, as well as homeowners who want to sell their property.
SOURCE Aurumys


- Over half of female investors in Singapore, North America and Australia are planning to invest more in the future
- Women across different regions identified three common major obstacles to investing
JERSEY CITY, N.J., March 8, 2024 /PRNewswire/ — World’s leading investment and trading platform moomoo released the findings from its first global women investor survey, leveraging data to unveil confronting challenges and needs of women retail investors.
Findings showed that surveyed female investors are planning to invest more in the future. Female investors from Singapore, Australia and North America gave a slightly bullish rate to the overall stock market at around 5.3 out of 10 in the survey. Additionally, more than half surveyed females from Singapore and North America, and around 80% of females from Australia said they want to trade more and increase their current portfolio.
Although women’s financial confidence is on the rise over the past few years, the survey results revealed a relatively low investment confidence level for women. The findings are based on data collected from 2,288 users of moomoo and its sister brand Futubull across five major markets, including Singapore, the U.S., Canada, Australia and Hong Kong SAR.
Surveyed female investors of all markets opted for a lower mark when asked to scale the confidence level of their investment decisions from 1 to 10. North American female investors demonstrated the highest average confidence level at 5.28, but represented the biggest gender confidence gap of almost 1 point behind the average level of North American males.
In a relationship, surveyed female investors are inclined to make financial decisions together with their partners, compared to male investors. In the survey, 70.8% Australian females and 56.3% North American females said they make financial decisions together with their long-term partners, versus 41.2% and 35.5% reported by male investors from Australia and North America, respectively.
Notably, surveyed Singapore and Hong Kong female investors overall show smaller gender difference in investment confidence, compared to North American and Australian peers. 54.1% of females in Hong Kong said they make all financial decisions by themselves when they’re in a long-term relationship.
This survey pinpointed three major obstacles to investing for female investors across all five markets, including limited capital, fear of unknown risks, and limited experience and knowledge of investing. Pioneering financial and investing education, the moomoo team introduces multiple solutions to help female investors navigate their investment journey with resilience against fear. Moomoo encourages investors to grow investing skills and share experiences in its interactive online investing community, where over 20 million investors assemble and free courses covering different investment categories are provided.
“Perceived self-biases may limit women from realizing their full potential in investing. With the right support and resources, investment can become a powerful tool that can redefine a woman’s financial resilience.” Erika Chiang, CMO of Moomoo SEA said.
While the majorities of both male and female groups believed they trust self-research as the best source to seek financial advice, a certain number of surveyed female investors reported friends and families as trusted source. 34.8% Hong Kong females and 23.5% Singapore females said friends or family members are their most trusted sources of financial advice, while only 17.8% Hong Kong males and 12.5% Singapore males did so.
As ESG investing continues to gain momentum globally, a higher percentage of women acknowledged the importance of integrating ESG factors into their investment decisions. In Australia, 38.3% of female investors find ESG very important in their investment decisions, versus 24% reported by male investors. In Singapore, Hong Kong and North America, over 70% of women think ESG are very important/somewhat important factors in investment.
Click HERE to read the full report of the survey.
About the survey
Moomoo and its sister brand Futubull conducted an in-app online survey among 2,288 users in February 2024 across five markets, including Hong Kong, Singapore, Australia and North America (Canada and U.S.), delving into their investment behaviors and perspectives on market involvement.
This content is provided by Moomoo Technologies Inc. Moomoo is a financial information and trading app offered by Moomoo Technologies Inc. The content is for informational and educational purposes only and is not investment advice or a recommendation of any specific securities or strategies.
About moomoo
Moomoo is a leading global investment and trading platform dedicated to empowering investors with user-friendly tools, data, and insights. Our platform is designed to provide essential information and technology, enabling users to make well-informed investment decisions. With advanced charting tools, pro-level analytical features, Moomoo evolves alongside our users, fostering a dynamic community where investors can share, learn, and grow together.
Founded in the US, Moomoo operates globally, serving investors in countries such as the US, Singapore, Australia, Japan, Canada and Malaysia. As a subsidiary of a Nasdaq-listed company, we take pride in our role as a global strategic partner of the New York Stock Exchange (NYSE), earning numerous international accolades from renowned industry leaders such as Best Trading Technology 2021, Best Investment Research Tech 2022, and Best Active Trading App 2021 awards from Benzinga and the Best Trading Platform 2022 award from Fintech Breakthrough. Moomoo has also received multiple awards in the US, Singapore, and Australia for its cutting edge, inclusive approach to investing.
About Futubull
Futubull positions itself as the next-generation of a one-stop trading and wealth management platform that integrates real-time market data, investment transactions, up-to-date news, and trading community. Futubull is currently available on Mac, Windows, iOS, and Android, providing lightning and secured trading experience to all levels of investors worldwide. Futubull is committed in transforming the market with unparalleled one-stop trading experience which allows investors to access global investible products at their fingertips, in the meantime, to exchange investment insights and enrich investing knowledge from the robust, most fast growing community.
For more information, please visit moomoo’s official website at www.moomoo.com or feel free to email: [email protected].
SOURCE moomoo


MONTRÉAL, Feb. 26, 2024 /CNW/ – BTB Real Estate Investment Trust (TSX: BTB.UN) (“BTB” or the “REIT“) releases today its financial results for the fourth quarter and year ended December 31st, 2023.
“I am delighted to reflect upon the remarkable journey that was 2023 for BTB.” says Michel Léonard, President and Chief Executive Officer. “The rental revenues, a cornerstone of our financial success, reached an all-time high of $127.8 million for the year, showcasing a remarkable 7.0% increase compared to the same period in 2022. This achievement is a testament to the effectiveness of our leasing strategies and the strategic repositioning of our portfolio. The total weight of our total industrial properties increased to 36.4%, from 18.1% in 2020.
In the last quarter alone, BTB completed 158,790 square feet of lease renewals, coupled with an additional 78,340 square feet of new leases. On an annual basis, BTB’s leasing accomplishments for 2023 were also impressive: a total of 485,751 square feet of lease renewals were successfully completed, complemented by 296,240 square feet of new leases. These figures affirm our sustained leasing momentum, underpinned by strategic initiatives that resonate with the evolving needs of our clients. As a direct result of these strong leasing endeavors, our occupancy rate surged to an impressive 94.2%, marking a significant 49 basis points increase compared to the prior quarter and an outstanding 99 basis points increase compared to the same period in 2022. The average lease renewal rental rate for the quarter demonstrated a substantial 14.3% increase, contributing to the overall growth trajectory.
The Net Operating Income (NOI), a key indicator of our operational excellence, totaled $75.4 million for the year, reflecting a 7.0% increase compared to the previous year. This growth is a direct result of our priority to value creation across our assets and our strategic focus on optimizing operational efficiencies. Our same-property NOI (1) demonstrated resilience and growth as we witnessed a 2.1% increase. Our leasing efforts in the necessity-based retail segment, coupled with enhanced rental spreads in the industrial sector, contributed significantly to this positive performance. For the off-downtown core office segment, we concluded the year with a notable 7.7% increase in the fourth quarter of the same-property NOI and an impressive increase in the lease renewal rental rate of 5.3%.
In January 2024 we published our inaugural Environmental, Social, and Governance (ESG) report. This milestone represents more than a document; it symbolizes our commitment to responsible growth, sustainability, and the highest standards of ethical business practices. As we actively integrate ESG initiatives into our daily practices, we are aligning our business strategies with broader environmental and social responsibilities. This is a pledge embedded in the fabric of our corporate culture.”
|
__________________________ |
|
(1) Non-IFRS financial measure. See Appendix 1. |
OPERATIONAL HIGHLIGHTS
BTB completed a total of 158,790 square feet of lease renewals and 78,340 square feet of new leases for the quarter. Due to strong leasing efforts, the occupancy rate increased to 94.2%, representing a 49 basis points increase compared to the prior quarter and a 99 basis points increase compared to the same period in 2022. The increase in the average renewal rate for the quarter was 14.3% and 9.2% for the year. BTB completed a total of 485,751 square feet of lease renewals and 296,240 square feet of new leases for the year.
|
Periods ended December 31 |
Quarter |
Year |
||
|
2023 |
2022 |
2023 |
2022 |
|
|
Occupancy – committed (%) |
94.2 % |
92.8 % |
||
|
Signed new leases (in sq.ft.) |
78,340 |
49,568 |
296,240 |
167,602 |
|
Renewed leases at term (in sq.ft.) |
126,427 |
87,399 |
384,558 |
356,454 |
|
Renewal rate (%) |
73.4 % |
53.0 % |
62.4 % |
63.0 % |
|
Renewed leases prior to the end of the term (in sq.ft.) |
32,363 |
66,633 |
101,193 |
148,736 |
|
Average increase lease renewal rental rate |
14.3 % |
8.0 % |
9.2 % |
12.2 % |
FINANCIAL RESULTS HIGHLIGHTS
|
Periods ended December 31 |
Quarter Year |
|||
|
(in thousands of dollars, except for ratios and per unit data) |
2023 |
2022 |
2023 |
2022 |
|
$ |
$ |
$ |
$ |
|
|
Rental revenue |
31,922 |
31,486 |
127,826 |
119,495 |
|
Net operating income (NOI) |
19,255 |
18,624 |
75,379 |
70,430 |
|
Net income and comprehensive income |
1,734 |
1,769 |
36,598 |
38,154 |
|
Adjusted EBITDA (1) |
18,065 |
16,347 |
69,719 |
64,409 |
|
Same-property NOI (1) |
17,636 |
16,552 |
66,533 |
65,152 |
|
FFO Adjusted (1) |
9,688 |
10,059 |
38,946 |
37,879 |
|
FFO adjusted payout ratio |
67.2 % |
63.6 % |
66.5 % |
66.1 % |
|
AFFO Adjusted (1) |
8,966 |
8,550 |
34,956 |
34,137 |
|
AFFO adjusted payout ratio |
72.6 % |
74.9 % |
74.1 % |
73.3 % |
|
FINANCIAL RESULTS PER UNIT |
||||
|
Net income and comprehensive income |
2.0¢ |
2.1¢ |
42.4¢ |
45.7¢ |
|
Distributions |
7.5¢ |
7.5¢ |
30.0¢ |
30.0¢ |
|
FFO Adjusted (1) |
11.1¢ |
11.8¢ |
45.1¢ |
45.4¢ |
|
AFFO Adjusted (1) |
10.3¢ |
10.0¢ |
40.5¢ |
40.9¢ |
- Rental revenue: Stood at $31.9 million for the current quarter, which represents an increase of 1.4% compared to the same quarter of 2022. For the year 2023, rental revenue totalled $127.8 million which represents an increase of 7.0% compared to the same period in 2022.
- Net Operating Income (NOI): Totalled $19.3 million for the current quarter, which represents an increase of 3.4% compared to the same quarter of 2022. For the year 2023, the NOI totalled $75.4 million which represents an increase of 7.0% compared to the same period in 2022.
- Net income and comprehensive income: Totalled $1.7 million for the quarter compared to $1.8 million for the same period in 2022. For the year 2023, Net income and comprehensive income totalled $36.6 million compared to $38.2 million for the same period in 2022, representing a decrease of $1.6 million. The decrease for the year 2023 is primarily driven by an increase in net financial expenses of $18.9 million offset by an increase in NOI of $5.0 million; an increase in financial income of $1.2 million and a positive variance of $10.2 million driven by net change in fair value of investment properties (Gain of $2.0 million for the year 2023 compared to a loss of $8.2 million for the year 2022).
- Same-property NOI (1): For the quarter the same-property NOI increased by 6.6% compared to the same period in 2022, and for the year 2023 increased by 2.1% compared to the same period last year. The increase is primarily due to increase in renewal rates of 21.4% for the year in the necessity-based retail segment, an increase in rental spreads for in-place leases in the industrial segment and recent strong leasing efforts for the off-downtown core office segment with a same-property NOI increase of 7.7% for the quarter.
- FFO adjusted per unit (1): Was 11.1¢ per unit for the quarter compared to 11.8¢ per unit for the same period in 2022, representing a decrease of 0.7¢ per unit. For the year 2023, the FFO adjusted was 45.1¢ per unit compared to 45.4¢ per unit for the same period in 2022, representing a decrease of 0.3¢ per unit. The $1.1 million increase of FFO adjusted for the year is driven by an NOI increase of $2.7 million due to acquisitions net of dispositions; NOI increase of $1.4 million due to leasing efforts and stability of occupancy rates offset by an increase in financial expenses net of financial income of $3.0 million. Despite the increase of FFO adjusted for the year 2023, the FFO adjusted per unit has decreased by 0.3¢ due to 3.2 million additional weighted average number of units outstanding reducing the per unit value compared to the same period in 2022.
- FFO adjusted payout ratio (1): Was 67.2% for the quarter compared to 63.6% for the same period in 2022. For the year 2023, the FFO adjusted payout ratio was 66.5% compared to 66.1% for the same period in 2022.
- AFFO adjusted per unit (1): Was 10.3¢ per unit for the quarter compared to 10.0¢ per unit for the same period in 2022, representing an increase of 0.3¢ per unit. For the year 2023, the AFFO adjusted per unit was 40.5¢ per unit compared to 40.9¢ per unit for the same period in 2022, representing a decrease of 0.4¢ per unit compared to the same period in 2022. Despite an increase of AFFO adjusted for the year of $0.8 million the FFO adjusted per unit has decreased due to an increase of 3.2 million in weighted average number of units outstanding reducing the per unit value.
- AFFO adjusted payout ratio (1): Was 72.6% for the quarter compared to 74.9% for the same period in 2022. For the year 2023, the AFFO adjusted payout ratio was 74.1% compared to 73.3% for the same period in 2022.
|
___________________________ |
|
(1) Non-IFRS financial measure. See Appendix 1. The referred non-IFRS financial measures do not have a standardized meaning prescribed by IFRS and these measures cannot be compared to similar measures used by other issuers. |
BALANCE SHEET AND LIQUIDITY HIGHLIGHTS
|
Periods ended December 31 |
Year |
|
|
(in thousands of dollars, except for ratios and per unit data) |
2023 |
2022 |
|
$ |
$ |
|
|
Total assets |
1,227,648 |
1,179,340 |
|
Total debt ratio (1) |
58.6 % |
58.5 % |
|
Mortgage debt ratio (2) |
52.2 % |
54.2 % |
|
Weighted average interest rate on mortgage debt |
4.37 % |
4.09 % |
|
Market capitalization |
254,048 |
311,120 |
|
Market price of units |
2.93 |
3.65 |
|
NAV per unit (1) |
5.42 |
5.42 |
- Investment properties: 75% of BTB’s properties were appraised by a third party during the quarter, resulting in a net gain of $2.0 million driven by an increase in capitalization rates across the 3 asset classes netted by the updated cash flow assumptions which were impacted by an increase in market rents for industrial assets and increased renewal rates for specific properties.
- Debt metrics: BTB ended the quarter with a total debt ratio (1) of 58.6%, recording an increase of 8 basis points compared to December 31, 2022. The REIT ended the quarter with a mortgage debt ratio (1) of 52.2%, a decrease of 202 basis points compared to December 31, 2022.
- Liquidity position: The REIT held $0.9 million of cash at the end of the quarter and $21.6 million is available under its credit facilities. The Trust has the option to increase its capacity under credit facilities by $10.0 million.
SUMMARY OF SIGNIFICANT ITEMS AS AT
DECEMBER 31
st, 2023
- Total number of properties: 77 (3)
- Total leasable area: 6.1 million square feet
- Total asset value: $1,228 million
- Market capitalization: $254 million (unit price of $2.93 as at December 31, 2023)
SUBSEQUENT EVENT
On February 26th, 2024, the Toronto Stock Exchange (the “TSX”) approved the renewal of the normal course issuer bid (“NCIB”) program authorized by the Trust’s Board of Trustees to repurchase for cancellation up to 6,085,804 units, from February 26,2024 to February 25,2025, representing approximately 7% of the Trust’s outstanding units and of its public float. As of December 31,2023, no units have been repurchased for cancellation under the NCIB.
|
_____________________________ |
|
(1) Non-IFRS financial measure. See Appendix 1. The referred non-IFRS financial measures do not have a standardized meaning prescribed by IFRS and these measures cannot be compared to similar measures used by other issuers. |
|
(2) This is a non-IFRS financial measure. The mortgage debt ratio is calculated by dividing the mortgage loans outstanding by the total gross value of the assets of the Trust less cash and cash equivalents. |
|
(3) Includes a property in Edmonton reclassified as a finance lease and not included in fair value. |
QUARTERLY CALL INFORMATION
Management will hold a conference call on Tuesday, February 27th, 2024, at 9 am, Eastern Time, to present BTB’s financial results and performance for the fourth quarter of 2023.
The media and all interested parties may attend the call-in listening mode only. Conference call operators will coordinate the question-and-answer period (from analysts only) and will instruct participants regarding the procedures during the call.
The audio recording of the conference call will be available via playback until
March 5th, 2024, by dialing: 1 416 764-8677 (local) or, 1 888 390-0541 (toll-free) and by entering the following access code: 669743 #
ABOUT BTB
BTB is a real estate investment trust listed on the Toronto Stock Exchange. BTB REIT invests in industrial, off-downtown core office and necessity-based retail properties across Canada for the benefit of their investors. As of today, BTB owns and manages 77 properties, representing a total leasable area of approximately 6.1 million square feet.
People and their stories are at the heart of our success.
For more detailed information, visit BTB’s website at www.btbreit.com.
FORWARD-LOOKING STATEMENTS
This press release may contain forward-looking statements with respect to BTB. These statements generally can be identified by the use of forward-looking words such as “may”, “will”, “expect”, “estimate”, “anticipate”, “intend”, “believe” or “continue” or the negative thereof or similar variations. The actual results and performance of BTB could differ materially from those expressed or implied by such statements. Such statements are qualified in their entirety by the inherent risks and uncertainties surrounding future expectations. Some important factors that could cause actual results to differ materially from expectations include, among other things, general economic and market factors, competition, changes in government regulation, and the factors described from time to time in the documents filed by BTB with the securities regulators in Canada. The cautionary statements qualify all forward-looking statements attributable to BTB and persons acting on their behalf. Unless otherwise stated or required by applicable law, all forward-looking statements speak only as of the date of this press release.
APPENDIX 1: RECONCILIATION OF NON-IFRS MEASURES
Non-IFRS Financial Measures
Certain terms used in this press release are listed and defined in the table hereafter, including any per unit information if applicable, are not measures recognized by International Financial Reporting Standards (“IFRS”) and do not have standardized meanings prescribed by IFRS. Such measures may differ from similar computations as reported by similar entities and, accordingly, may not be comparable to similar measures. Explanations on how these non-IFRS financial measures provide useful information to investors and additional purposes, if any, for which the Trust uses these non-IFRS financial measures, are also included in the table hereafter.
Securities regulations require that non-IFRS financial measures be clearly defined and that they not be assigned greater weight than IFRS measures. The referred non-IFRS financial measures, which are reconciled to the most similar IFRS measure in the table thereafter if applicable, do not have a standardized meaning prescribed by IFRS and these measures cannot be compared to similar measures used by other issuers.
|
NON-IFRS MEASURE |
DEFINITION |
|
Adjusted net income |
Adjusted net income is a non-IFRS financial measure that starts with net income and comprehensive income and removes the effects of: (i) fair value adjustment of investment properties; (ii) fair value adjustment of derivative financial instruments; (iii) fair value adjustment of Class B LP units; and (iv) transaction costs incurred for acquisitions and dispositions of investment properties and early repayment fees. The Trust considers this to be a useful measure of operating performance, as fair value adjustments can fluctuate widely with the real estate market and transaction costs are non-recurring in nature. |
|
Adjusted Earnings Before Interest, Taxes, Depreciation and Amortization (“Adjusted EBITDA”) |
Adjusted EBITDA income is a non-IFRS financial measure that starts with net income and comprehensive income and removes the effects of certain adjustments, on a proportionate basis, including: (i) interest expense; (ii) taxes; (iii) depreciation of property and equipment; (iv) amortization of intangible assets; (v) fair value adjustments (including adjustments of investment properties, of financial instruments, of Class B LP units and of unit price adjustments related to unit-based compensation); (vi) transaction costs for acquisitions and dispositions of investment properties and early repayment fees; and (vii) straight-line rental revenue adjustments. The most directly comparable IFRS measure to Adjusted EBITDA is net income and comprehensive income. The Trust believes Adjusted EBITDA is a useful metric to determine its ability to service debt, to finance capital expenditures and to provide distributions to its Unitholders. |
|
Same-Property NOI |
Same-Property NOI is a non-IFRS financial measure defined as net operating income (“NOI”) for the properties that the Trust owned and operated for the entire duration of both the current year and the previous year. The most directly comparable IFRS measure to same-property NOI is Operating Income. The Trust believes this is a useful measure as NOI growth can be assessed on its portfolio by excluding the impact of property acquisitions and dispositions of both the current year and previous year. The Trust uses the Same-Property NOI to indicate the profitability of its existing portfolio operations and the Trust’s ability to increase its revenues, reduce its operating costs and generate organic growth. |
|
Funds from Operations (“FFO”) and FFO Adjusted |
FFO is a non-IFRS financial measure used by most Canadian real estate investment trusts based on a standardized definition established by REALPAC in its January 2022 White Paper (“White Paper”). FFO is defined as net income and comprehensive income less certain adjustments, on a proportionate basis, including: (i) fair value adjustments on investment properties, class B LP units and derivative financial instruments; (ii) amortization of lease incentives; (iii) incremental leasing costs; and (iv) distribution on class B LP units. FFO is reconciled to net income and comprehensive income, which is the most directly comparable IFRS measure. FFO is also reconciled with the cash flows from operating activities, which is an IFRS measure. FFO Adjusted is also a non-IFRS financial measure that starts with FFO and remove the impact of non-recurring items such as transaction cost on acquisitions and dispositions of investment properties and early repayment fees. The Trust believes FFO and FFO Adjusted are key measures of operating performance and allow the investors to compare its historical performance. |
|
Adjusted Funds from Operations (“AFFO”) and AFFO Adjusted |
AFFO is a non-IFRS financial measure used by most Canadian real estate investment trusts based on a standardized definition established by REALPAC in its White Paper. AFFO is defined as FFO less: (i) straight-line rental revenue adjustment; (ii) accretion of effective interest; (iii) amortization of other property and equipment; (iv) unit-based compensation expenses; (v) provision for non-recoverable capital expenditures; and (vi) provision for unrecovered rental fees (related to regular leasing expenditures). AFFO is reconciled to net income and comprehensive income, which is the most directly comparable IFRS measure. AFFO is also reconciled with the cash flows from operating activities, which is an IFRS measure. AFFO Adjusted is also a non-IFRS financial measure that starts with AFFO and removes the impact of non-recurring items such as transaction costs on acquisitions and dispositions of investment properties and early repayment fees. The Trust considers AFFO and AFFO Adjusted to be useful measures of recurring economic earnings and relevant in understanding its ability to service its debt, fund capital expenditures and provide distributions to unitholders. |
|
FFO and AFFO per unit and FFO adjusted and AFFO adjusted per unit |
FFO and AFFO per unit and FFO adjusted and AFFO adjusted per unit are non-IFRS financial measures used by most Canadian real estate investment trusts based on a standardized definition established by REALPAC in its White Paper. These ratios are calculated by dividing the FFO, AFFO, FFO adjusted and AFFO adjusted by the Weighted average number of units and Class B LP units outstanding. The Trust believes these metrics to be key measures of operating performances allowing the investors to compare its historical performance in relation to an individual per unit investment in the Trust. |
|
FFO and AFFO payout ratios and FFO Adjusted and AFFO Adjusted payout ratios |
FFO and AFFO payout ratios and FFO Adjusted and AFFO Adjusted payout ratios are non-IFRS financial measures used by most Canadian real estate investment trusts based on a standardized definition established by REALPAC in its White Paper. These payout ratios are calculated by dividing the actual distributions per unit by FFO, AFFO and FFO Adjusted and AFFO Adjusted per unit in each period. The Trust considers these metrics a useful way to evaluate its distribution paying capacity. |
|
Total debt ratio |
Total debt ratio is a non-IFRS financial measure of the Trust financial leverage, which is calculated by taking the total long-term debt less cash divided by total gross value of the assets of the Trust less cash. The Trust considers this metric useful as it indicates its ability to meet its debt obligations and its capacity for future additional acquisitions. |
|
Interest Coverage Ratio |
Interest coverage ratio is a non-IFRS financial measure which is calculated by taking the Adjusted EBITDA divided by interest expenses net of financial income (interest expenses exclude early repayment fees, accretion of effective interest, distribution on Class B LP units, accretion of non-derivative liability component of convertible debentures and the fair value adjustment on derivative financial instruments and Class B LP units). The Trust considers this metric useful as it indicates its ability to meet its interest cost obligations for a given period. |
|
Debt Service Coverage Ratio |
Debt service coverage ratio is a non-IFRS financial measure which is calculated by taking the Adjusted EBITDA divided by the Debt Service Requirements, which consists of principal repayments and interest expenses net of financial income (interest expenses exclude early repayment fees, accretion of effective interest, distribution on Class B LP units, accretion of non-derivative liability component of convertible debentures and the fair value adjustment on derivative financial instruments and Class B LP units). The Trust considers this metric useful as it indicates its ability to meet its interest cost obligations for a given period. |
|
Provision For Non-Recoverable Capital Expenditures |
In calculating adjusted AFFO, the Trust deducts a provision for non-recoverable capital expenditures to consider capital expenditures invested to maintain the condition of its properties and to preserve rental revenue. The provision for non-recoverable capital expenditures is calculated based on 2% of rental revenues. This provision is based on management’s assessment of industry practices and its investment forecasts for the coming years. |
|
Provision For Unrecovered Rental Fees |
The Trust also deducts a provision for unrecovered rental fees in the amount of approximately 25¢ per sq. ft. on an annualized basis. Even though quarterly rental fee disbursements vary significantly from one quarter to another, management considers that this provision fairly presents, in the long term, the average disbursements not recovered directly in establishing the rent that the Trust will undertake. These disbursements consist of inducements paid or granted when leases are signed that are generally amortized over the term of the lease and are subject to an equivalent increase in rent per square foot, and of brokerage commissions and leasing payroll expenses. |
|
Total Long-Term Debt Less Cash And Cash Equivalents |
This is a non-IFRS financial measure. Long-term debt less cash and cash equivalent is a non-IFRS financial measure, calculated as the total of (i) fixed-rate mortgage loans payable; (ii) floating rate mortgage loans payable; (iii) Series G debenture capital amount; (iv) Series F debenture capital adjusted with non-derivative component fewer conversion options exercised by holders; and (v) credit facilities, less cash, and cash equivalents. The most directly comparable IFRS measure to net debt is debt. |
|
Total Gross Value Of The Assets Of The Trust Less Cash And Cash Equivalent |
This is a non-IFRS financial measure. Gross value of the assets of the Trust less cash and cash equivalent (“GVALC”) is a non-IFRS financial measure defined as the Trust’s total assets adding the cumulated amortization property and equipment and removing the cash and cash equivalent. The most directly comparable IFRS measure to GVALC is total assets. |
NON-IFRS FINANCIAL MEASURES – ANNUAL RECONCILIATION
Funds from Operations (FFO) (1)
The following table provides a reconciliation of net income and comprehensive income established in accordance with IFRS and FFO (1) for the years ended December 31, 2023, 2022 and 2021:
|
Years ended December 31 |
Year |
|||
|
(in thousands of dollars, except for per unit) |
2023 |
2022 |
2021 |
|
|
$ |
$ |
$ |
||
|
Net income and comprehensive income (IFRS) |
36,598 |
38,154 |
41,568 |
|
|
Fair value adjustment on investment properties |
(2,001) |
8,201 |
(19,571) |
|
|
Fair value adjustment on Class B LP units |
(976) |
(149) |
231 |
|
|
Amortization of lease incentives |
2,783 |
3,113 |
3,292 |
|
|
Fair value adjustment on derivative financial instruments |
1,233 |
(14,216) |
3,246 |
|
|
Leasing payroll expenses (6) |
1,443 |
1,243 |
784 |
|
|
Distributions – Class B LP units |
172 |
104 |
108 |
|
|
Unit-based compensation (Unit price remeasurement) (5) |
(389) |
(182) |
189 |
|
|
FFO (1) |
38,863 |
36,268 |
29,847 |
|
|
Transaction costs on disposition of investment properties and mortgage early repayment fees |
83 |
1,611 |
297 |
|
|
FFO Adjusted (1) |
38,946 |
37,879 |
30,144 |
|
|
FFO per unit (1) (2) (3) |
45.0¢ |
43.5¢ |
41.7¢ |
|
|
FFO Adjusted per unit (1) (2) (4) |
45.1¢ |
45.4¢ |
42.1¢ |
|
|
FFO payout ratio (1) |
66.6 % |
69.0 % |
71.9 % |
|
|
FFO Adjusted payout ratio (1) |
66.5 % |
66.1 % |
71.2 % |
|
|
(1) |
This is a non-IFRS financial measure. |
|
(2) |
Including Class B LP units. |
|
(3) |
The FFO per unit ratio is calculated by dividing the FFO (1) by the Trust’s unit outstanding at the end of the period (including the Class B LP units at outstanding at the end of the period). |
|
(4) |
The FFO Adjusted per unit ratio is calculated by dividing the FFO Adjusted (1) by the Trust’s unit outstanding at the end of the period (including the Class B LP units at outstanding at the end of the period). |
|
(5) |
The impact of the unit price remeasurement on the deferred unit-based compensation plan has been considered in the calculation of the FFO Adjusted and AFFO Adjusted starting Q2 2021. As a reference, the cumulative impact for the 12 months cumulative period in 2020 was positive $373 or 0.1¢ per unit. |
|
(6) |
The impact of the CIO compensation, hired in Q2 2022, was added to the Leasing payroll expenses during Q4 2022 as his duties were mainly leasing activities throughout the year. |
Adjusted Funds from Operations (AFFO) (1)
The following table provides a reconciliation of FFO (1) and AFFO (1) for the years ended December 31, 2023, 2022 and 2021:
|
Years ended December 31 |
Year |
||
|
(in thousands of dollars except for per unit) |
2023 |
2022 |
2021 |
|
$ |
$ |
$ |
|
|
FFO (1) |
38,863 |
36,268 |
29,847 |
|
Straight-line rental revenue adjustment |
(1,963) |
(1,822) |
(1,334) |
|
Accretion of effective interest |
1,095 |
1,127 |
1,301 |
|
Amortization of other property and equipment |
99 |
122 |
87 |
|
Unit-based compensation expenses |
836 |
721 |
877 |
|
Provision for non-recoverable capital expenditures (1) |
(2,557) |
(2,390) |
(2,007) |
|
Provision for unrecovered rental fees (1) |
(1,500) |
(1,500) |
(1,500) |
|
AFFO (1) |
34,873 |
32,526 |
27,271 |
|
Transaction costs on disposition of investment properties and mortgage early repayment fees |
83 |
1,611 |
297 |
|
AFFO Adjusted (1) |
34,956 |
34,137 |
27,568 |
|
AFFO per unit (1) (2) (3) |
40.4¢ |
40.4¢ |
38.1¢ |
|
AFFO Adjusted per unit (1) (2) (4) |
40.5¢ |
40.5¢ |
38.5¢ |
|
AFFO payout ratio (1) |
74.2 % |
74.2 % |
78.7 % |
|
AFFO Adjusted payout ratio (1) |
74.1 % |
74.1 % |
77.9 % |
|
(1) |
This is a non-IFRS financial measure. |
|
(2) |
Including Class B LP units. |
|
(3) |
The AFFO per unit ratio is calculated by dividing the AFFO (1) by the Trust’s unit outstanding at the end of the period (including the Class B LP units at outstanding at the end of the period). |
|
(4) |
The AFFO Adjusted per unit ratio is calculated by dividing the AFFO Adjusted (1) by the Trust’s unit outstanding at the end of the period (including the Class B LP units at outstanding at the end of the period). |
Debt Ratios
The following table summarizes the Trust’s debt ratios as at December 31, 2023, and 2022 and December 31 2022:
|
(in thousands of dollars) |
December 31, 2023 |
December 31, 2022 |
|
$ |
$ |
|
|
Cash and cash equivalents |
(912) |
(2,404) |
|
Mortgage loans outstanding (1) |
640,425 |
638,441 |
|
Convertible debentures (1) |
43,185 |
43,170 |
|
Credit facilities |
36,359 |
9,897 |
|
Total long-term debt less cash and cash equivalents (2) (3) |
719,057 |
689,104 |
|
Total gross value of the assets of the Trust less cash and cash equivalents (2) (4) |
1,227,949 |
1,178,049 |
|
Mortgage debt ratio (excluding convertible debentures and credit facilities) (2) (5) |
52.2 % |
54.2 % |
|
Debt ratio – convertible debentures (2) (6) |
3.5 % |
3.7 % |
|
Debt ratio – credit facilities (2) (7) |
3.0 % |
0.8 % |
|
Total debt ratio (2) |
58.6 % |
58.5 % |
|
(1) |
Before unamortized financing expenses and fair value assumption adjustments. |
|
(2) |
This is a non-IFRS financial measure. |
|
(3) |
Long-term debt less free cash flow is a non-IFRS financial measure, calculated as total of: (i) fixed rate mortgage loans payable; (ii) floating rate mortgage loans payable; (iii) Series G debenture capital amount; (iv) Series F debenture capital adjusted with non-derivative component less conversion options exercised by holders; and (v) credit facilities, less cash and cash equivalents. The most directly comparable IFRS measure to net debt is debt. |
|
(4) |
Gross value of the assets of the Trust less cash and cash equivalent (“GVALC”) is a non-IFRS financial measure defined as the Trust total assets adding the cumulated amortization property and equipment and removing the cash and cash equivalent. The most directly comparable IFRS measure to GVALC is total assets. |
|
(5) |
Mortgage debt ratio is calculated by dividing the mortgage loans outstanding by the GVALC. |
|
(6) |
Debt ratio – convertible debentures is calculated by dividing the convertible debentures by GVALC. |
|
(7) |
Debt ratio – credit facilities is calculated by dividing the credit facilities by the GVALC. |
NON-IFRS FINANCIAL MEASURES – QUARTERLY RECONCILIATION
Funds from Operations (FFO) (1)
The following table provides a reconciliation of net income and comprehensive income established in accordance with IFRS and FFO (1) for the last eight quarters:
|
2023 Q-4 |
2023 Q-3 |
2023 Q-2 |
2023 Q-1 |
2022 Q-4 |
2022 Q-3 |
2022 Q-2 |
2022 Q-1 |
|
|
(in thousands of dollars, except for per unit) |
$ |
$ |
$ |
$ |
$ |
$ |
$ |
$ |
|
Net income and comprehensive income (IFRS) |
1,734 |
15,216 |
10,846 |
8,802 |
1,769 |
11,693 |
18,243 |
6,449 |
|
Fair value adjustment on investment properties |
4,480 |
(6,481) |
– |
– |
7,781 |
1,230 |
197 |
(1,007) |
|
Fair value adjustment on Class B LP units |
(42) |
(159) |
(775) |
– |
160 |
(142) |
(233) |
66 |
|
Amortization of lease incentives |
641 |
664 |
750 |
728 |
787 |
773 |
818 |
735 |
|
Fair value adjustment on derivative financial instruments |
2,396 |
(584) |
(763) |
184 |
(1,971) |
(3,898) |
(9,344) |
997 |
|
Leasing payroll expenses (6) |
401 |
359 |
327 |
356 |
682 |
182 |
158 |
221 |
|
Distributions – Class B LP units |
52 |
56 |
42 |
22 |
26 |
26 |
26 |
26 |
|
Unit-based compensation (Unit price remeasurement) (5) |
(11) |
(87) |
(232) |
(59) |
198 |
(172) |
(285) |
77 |
|
FFO (1) |
9,651 |
8,984 |
10,195 |
10,033 |
9,432 |
9,692 |
9,580 |
7,564 |
|
Transaction costs on disposition of investment properties and mortgage early repayment fees |
37 |
46 |
– |
– |
627 |
93 |
138 |
753 |
|
FFO Adjusted (1) |
9,688 |
9,030 |
10,195 |
10,033 |
10,059 |
9,785 |
9,718 |
8,317 |
|
FFO per unit (1) (2) (3) |
11.1¢ |
10.3¢ |
11.8¢ |
11.7¢ |
11.0¢ |
11.4¢ |
11.3¢ |
9.7¢ |
|
FFO Adjusted per unit (1) (2) (4) |
11.1¢ |
10.4¢ |
11.8¢ |
11.7¢ |
11.8¢ |
11.5¢ |
11.4¢ |
10.7¢ |
|
FFO payout ratio (1) |
67.5 % |
72.9 % |
63.8 % |
64.1 % |
67.9 % |
65.9 % |
66.4 % |
77.2 % |
|
FFO Adjusted payout ratio (1) |
67.2 % |
72.5 % |
63.8 % |
64.1 % |
63.6 % |
65.2 % |
65.5 % |
70.2 % |
|
(1) |
This is a non-IFRS financial measure. |
|
(2) |
Including Class B LP units. |
|
(3) |
This is a non-IFRS financial measure. The FFO per unit ratio is calculated by dividing the FFO (1) by the Trust’s unit outstanding at the end of the period (including the Class B LP units at outstanding at the end of the period). |
|
(4) |
This is a non-IFRS financial measure. The recurring FFO per unit ratio is calculated by dividing the recurring FFO (1) by the Trust’s unit outstanding at the end of the period (including the Class B LP units at outstanding at the end of the period). |
|
(5) |
The impact of the unit price remeasurement on the deferred unit-based compensation plan has been considered in the calculation of the recurring FFO and AFFO starting Q2 2021. |
|
(6) |
The impact of the CIO compensation, hired in Q2 2022, was added to the Leasing payroll expenses during Q4 2022 as his duties were mainly leasing activities throughout the year. |
Adjusted Funds from Operations (AFFO) (1)
The following table provides a reconciliation of FFO (1) and AFFO (1) for the last eight quarters:
|
2023 Q-4 |
2023 Q-3 |
2023 Q-2 |
2023 Q-1 |
2022 Q-4 |
2022 Q-3 |
2022 Q-2 |
2022 Q-1 |
|
|
(in thousands of dollars, except for per unit) |
$ |
$ |
$ |
$ |
$ |
$ |
$ |
$ |
|
FFO (1) |
9,651 |
8,984 |
10,195 |
10,033 |
9,432 |
9,692 |
9,580 |
7,564 |
|
Straight-line rental revenue adjustment |
(197) |
(842) |
(291) |
(633) |
(1,077) |
(521) |
(74) |
(150) |
|
Accretion of effective interest |
310 |
271 |
278 |
236 |
336 |
219 |
284 |
288 |
|
Amortization of other property and equipment |
20 |
33 |
23 |
23 |
31 |
35 |
26 |
30 |
|
Unit-based compensation expenses |
159 |
184 |
237 |
256 |
206 |
130 |
312 |
73 |
|
Provision for non-recoverable capital expenditures (1) |
(639) |
(626) |
(634) |
(658) |
(630) |
(599) |
(580) |
(581) |
|
Provision for unrecovered rental fees (1) |
(375) |
(375) |
(375) |
(375) |
(375) |
(375) |
(375) |
(375) |
|
AFFO (1) |
8,929 |
7,629 |
9,433 |
8,882 |
7,923 |
8,581 |
9,173 |
6,849 |
|
Transaction costs on disposition of investment properties and mortgage early repayment fees |
37 |
46 |
– |
– |
627 |
93 |
138 |
753 |
|
AFFO Adjusted (1) |
8,966 |
7,675 |
9,433 |
8,882 |
8,550 |
8,674 |
9,311 |
7,602 |
|
AFFO per unit (1) (2) (3) |
10.2¢ |
8.8¢ |
10.9¢ |
10.3¢ |
9.3¢ |
10.1¢ |
10.8¢ |
8.8¢ |
|
AFFO Adjusted per unit (1) (2) (4) |
10.3¢ |
8.8¢ |
10.9¢ |
10.3¢ |
10.0¢ |
10.2¢ |
11.0¢ |
9.7¢ |
|
AFFO payout ratio (1) |
72.9 % |
85.8 % |
69.0 % |
72.4 % |
80.8 % |
74.4 % |
69.4 % |
85.3 % |
|
AFFO Adjusted payout ratio (1) |
72.6 % |
85.3 % |
69.0 % |
72.4 % |
74.9 % |
73.6 % |
68.3 % |
76.8 % |
|
(1) |
This is a non-IFRS financial measure. |
|
(2) |
Including Class B LP units. |
|
(3) |
The AFFO per unit ratio is calculated by dividing the AFFO (1) by the Trust’s unit outstanding at the end of the period (including the Class B LP units at outstanding at the end of the period). |
|
(4) |
The recurring AFFO per unit ratio is calculated by dividing the recurring AFFO (1) by the Trust’s unit outstanding at the end of the period (including the Class B LP units at outstanding at the end of the period). |
SOURCE BTB Real Estate Investment Trust

For further information: Philippine Soulié, Director of Communications, (T) 514-286-0188 x236, (E) [email protected]
Still, builders have the advantage as we head into the spring selling season. Limited resale inventory, the narrowing of the price spread between new and resale homes, the value proposition of a new home in the face of higher home prices and mortgage rates, and the use of incentives and buydowns to help address affordability challenges have contributed to more home shoppers funneling into the new home market.
“Stability in mortgage rates is key for housing demand,” said Ali Wolf, chief economist with Zonda. “When house hunters start their search able to afford a home at one price and just days later the parameters change because mortgage rates have moved, it causes confusion and frustration. Herein lies the benefit of buying a new home today given mortgage rate buydowns and extended rate locks.”
New home sales have a healthy start to the year
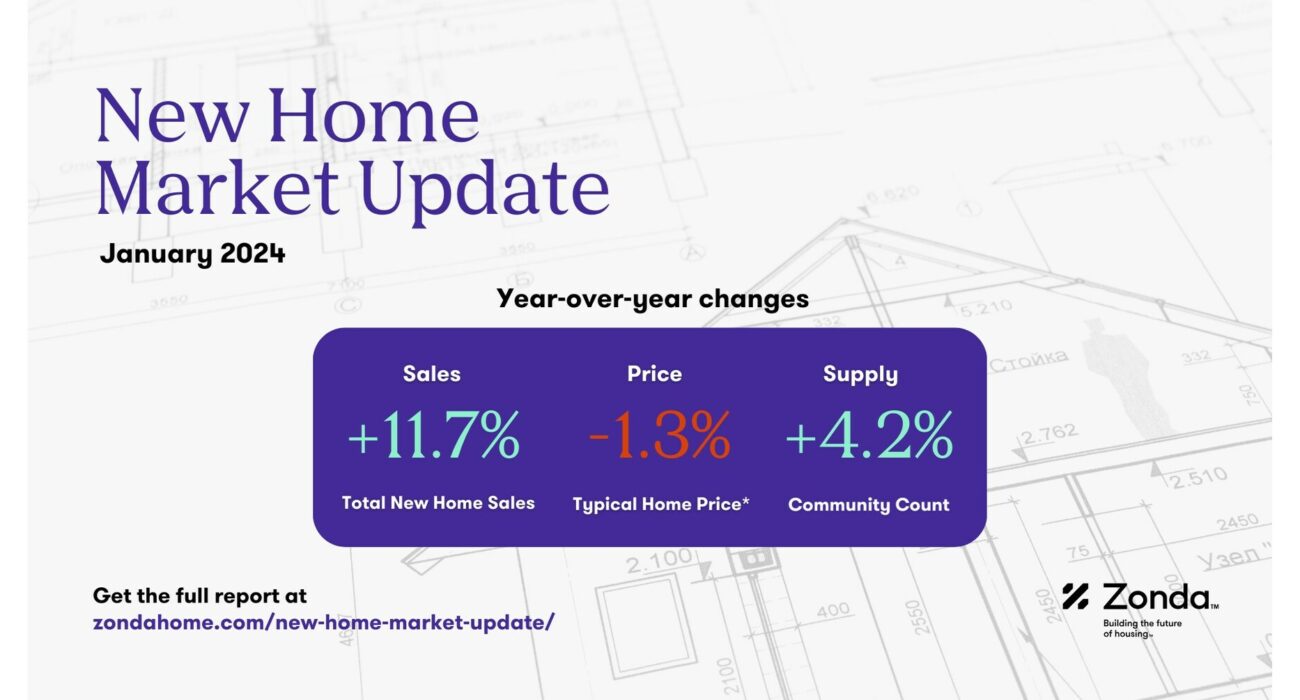
Zonda’s new home sales metric counts the number of new home contract sales each month and accounts for both cancellations and seasonality. This metric shows there were 664,380 new homes sold in January on a seasonally adjusted annualized rate. This was a decline of 1.6% from last month but an increase of 11.7% from a year ago. On a non-seasonally adjusted basis, 55,257 homes were sold, 12.2% higher than last year and 2.1% below the same month in 2019.
Zonda’s revised numbers show 674,000 new homes were sold in the full year of 2023, an increase of 12% from 2022.
The New Home PSI was down slightly month-over-month
Total sales volume is influenced by both supply and demand. Zonda’s New Home Pending Sales Index (PSI) was created to help account for fluctuations in supply by combining both total sales volume with the average sales rate per month per community. The January PSI came in at 128.8, representing a 13.6% rise from the same month last year. The index is currently 26.1% below cycle highs. On a month-over-month basis, seasonally adjusted new home sales decreased 1.2%.
- The markets that posted the best numbers relative to last year were Las Vegas (+68.6%), Phoenix (+51.6%), and Los Angeles/OC (+44.7%). These markets were still slow in early 2023 following the pullback in 2022. The base effect of those low levels contributed to the large YOY percentages.
- San Francisco (-7.8%), Charlotte (-6.7%), and New York (-2.6%) declined year-over-year.
- On a monthly basis, New York, Las Vegas, and Cincinnati performed best.
Nearly half of new home markets were overperforming in January
In order to add further context on the metro level, we created the Zonda Market Ranking (ZMR). The ZMR accounts for both sales pace and volume, is seasonally adjusted, and is taken as a percentage relative to a baseline market average. Based on the percentage above or below baseline, markets are bucketed into performance groups ranging from significantly underperforming to significantly overperforming relative to historical activity.
- The National ZMR index came in at 103.7 in January, indicating an average market, an improvement from a slightly underperforming market last year.
- The major metros overperforming their historical averages most in January 2024 were Chicago, Fort Collins, and Las Vegas.
- Five markets were significantly underperforming – San Francisco, San Jose, Reno, Salt Lake City, and Portland. Seattle, Durham, Austin, and Orlando were slightly underperforming.
- Among our top fifty markets, 46% were overperforming, 36% were average, and 18% were underperforming. Last month, 36% were overperforming, 42% were average, and 22% were underperforming.
- Importantly, the ZMR does not account for what it takes to sell a home. For example, securing a sale might still feel difficult in a “significantly overperforming” market, but if incentives offered result in a sale, we count the sale.
Prices declined again for entry-level and move-up segments
National home prices fell 1.8% for entry-level to $331,174 and 1.3% for move-up to $519,307. Prices rose 1.0% for high-end homes to $912,911.
Supplementing our data with a monthly survey Zonda conducts, 42% of builders reported raising prices in January, up from 18% in December. Further, 54% reported holding prices flat, down from 71% last month.
Incentives are still common in today’s housing market to help address the affordability constraints for buyers. 56% of new home communities across the country offered incentives in January, flat month-over-month. Incentives have been a critical sales tool in today’s market.
Community count rose year-over-year for 11th consecutive month
There are currently 14,409 actively selling communities tracked by Zonda, up 4.2% from last year. On a month-over-month basis, the national figure slipped 1.7%. Total community count is 24.5% below the same month in 2019. The lack of competition from other new home communities has allowed for some upward pressure on the average sales rate per month per community. Zonda defines a community as anywhere where five or more units are for sale.
- Salt Lake City (+18.8%), Austin (+14.6%), and Orlando (+13.0%) grew community count the most year-over-year. Relative to 2019, community count was down 25%, 15%, and 30%, respectively.
- The biggest community count declines were in San Francisco (-19.0%), Philadelphia (-15.4%), and Baltimore (-12.8%).
- Community count rose month-over-month in 4% of our select markets, 4% were flat, and 92% fell.
National quick move-ins (QMIs) totaled 26,891, down 13.9% compared to last year and 12.5% lower month-over-month. Total QMIs are 145.3% above 2019 levels. QMIs are homes that can likely be occupied within 90 days.
For many consumers, QMIs provide a great option given the lack of resale supply. As a result, some builders have pivoted to a more spec-heavy strategy to help capture today’s buyers.
- On a metro basis, 24% of Zonda’s select markets increased QMI count year-over-year. The markets that grew the most year-over-year were Riverside/San Bernardino (+28.6%), Las Vegas (+24.0%), and Cincinnati (+23.6%).
- Las Vegas, Cincinnati, and Phoenix have seen the most growth in QMIs compared to the same time in 2019, up 212.2%, 152.8%, and 143.7%, respectively.
- QMIs are down the most compared to 2019 in Seattle (-66%), San Francisco (-62%), and Baltimore (-55%).
Methodology
The Zonda New Home Pending Sales Index (PSI) is built on proprietary, industry-leading data that covers 60% of the production new home market across the United States. Reported number of new home pending contracts are gathered and analyzed each month. Released on the 15th business day of each month, the New Home PSI is a leading indicator of housing demand compared to closings because it is based on the number of signed contracts at a new home community. Zonda monitors 18,000 active communities in the country and the homes tracked can be in any stage of construction.
The new home market represents roughly 10% of all transactions, allowing little movements in supply to cause outsized swings in market activity. As a result, the New Home PSI blends the cumulative sales of activity recently sold-out projects with the average sales rate per community, which adjusts for fluctuations in supply. Furthermore, the New Home PSI is seasonally adjusted based on each markets’ specific seasonality, removes outliers, and uses June 2016 as the base month. The foundation of the index is a monthly survey conducted by Zonda. It is necessary to monitor both new and existing home sales to establish an accurate picture of the relative health of the residential real estate market.
Visit ZondaHome.com or follow us on LinkedIn and Facebook for more information.
About Zonda
Zonda provides data-driven housing market solutions to the homebuilding industry. From builders to building product manufacturers, mortgage clients, and multifamily executives, we work hand-in-hand with our customers to streamline access to housing data to empower smarter decisions. As a leading brand in residential construction, our mission is to advance the home building industry, because we believe better homes mean better lives and stronger communities. Together, we are building the future of housing.
Media Contact
Valerie Sheets, Zonda, 949-294-9557, [email protected], https://zondahome.com
SOURCE Zonda


WASHINGTON, Feb. 22, 2024 /PRNewswire/ — The Managing Partners of Gainful Solutions, Ambassador Michael Ranneberger and Mr. Soheil Nazari-Kangarlou, and their Partners, Mr. Stephen Hayes and retired Colonel Dr. Isaiah Wilson, are honored to welcome Dr. Genevieve Lester and Mr. Vance Martin as senior consultants.
Dr. Genevieve Lester served as the De Serio Chair of Strategic Intelligence at the US Army War College from 2016 until 2023. She was academic lead for intelligence matters and advised senior leadership at the Army War College. She recently engaged Director of the Central Intelligence Agency William Burns in a fireside chat for students and faculty. She is an Associate Fellow for Strategic Intelligence at the International Institute for Strategic Studies. She has served as faculty and coordinator of intelligence studies at the Security Studies Program, School of Foreign Service and as a senior fellow at the Center for Security Studies at Georgetown. She has held positions at the National Defense University, Chatham House, and the RAND Corporation. She holds a PhD and MA in Political Science from the University of California, Berkeley, an MA in International Economics/International Law and Organizations from the Johns Hopkins School of Advanced International Studies, and a BA in history from Carleton College. She began her career at the Survivors of the Shoah Visual History Foundation, Steven Spielberg’s visual history project. She is the author of the award-winning When Should State Secrets Stay Secret? Democratic Governance, Accountability, and Intelligence and numerous other publications.
Vance G. Martin has devoted his life to advancing international nature , uniting wildlife and wildland protection with the needs of human communities. He created and built-out the WILD Foundation, a US based, globally-focused non-profit known for its many signature programs, including the World Wilderness Congress, Nature Needs Half, Mali Elephant Project, among others. He is President (Emeritus) of Wilderness Foundation Global, an international alliance of conservation groups. Vance has worked and/or lived in more than 100 countries, collaborating with a network he helped to create that focuses on protecting wild nature while meeting the needs of and working in partnership with indigenous and local communities. To create effective and enduring solutions, Martin has a firm commitment to the importance of culture as an equal partner to science, policy, and economics. This includes the critical role of youth and of indigenous peoples in crafting solutions for our collective future by being at the negotiating table from the beginning and engaging decision-makers at all levels from heads of state, to CEOs, to local leaders. He is a founder/Co-Chairman of the Wilderness Specialist Group in the World Commission on Protected Areas/IUCN; a Director of the International Conservation Caucus Foundation (Washington DC); a Trustee of the Cheetah Conservation Fund (Namibia); an International Advisor to EcoForum Global (China); and on the International Advisory Board, Sanctuary Nature Foundation (India).
Find us at www.gainfulsolutions.com
Media contact:
Alex Casanova
[email protected]
4158462501
SOURCE Gainful Solutions

Beyond financial accomplishments, Capitalixe strategically broadened its presence in key markets throughout 2023, now encompassing regions such as South America, Africa, Southeast Asia, and South and Eastern Europe. This expansion positions the consultancy to deliver a more comprehensive and globally impactful service.
Lissele Pratt, Co-founder & CGO, has been instrumental in crafting the strategic direction of our company, playing a pivotal role in its substantial growth. Emphasising brand exposure, thought leadership, and active industry participation, Pratt stated, “Our journey in 2023 has been exhilarating, not just financially but also in solidifying our position as a thought leader within the fintech sector. We remain committed to excellence and innovation in the fintech arena.” Pratt’s strategic acumen extends beyond financial growth, focusing on building a team with strong values and collaborative spirit, crucial for driving the company’s success.
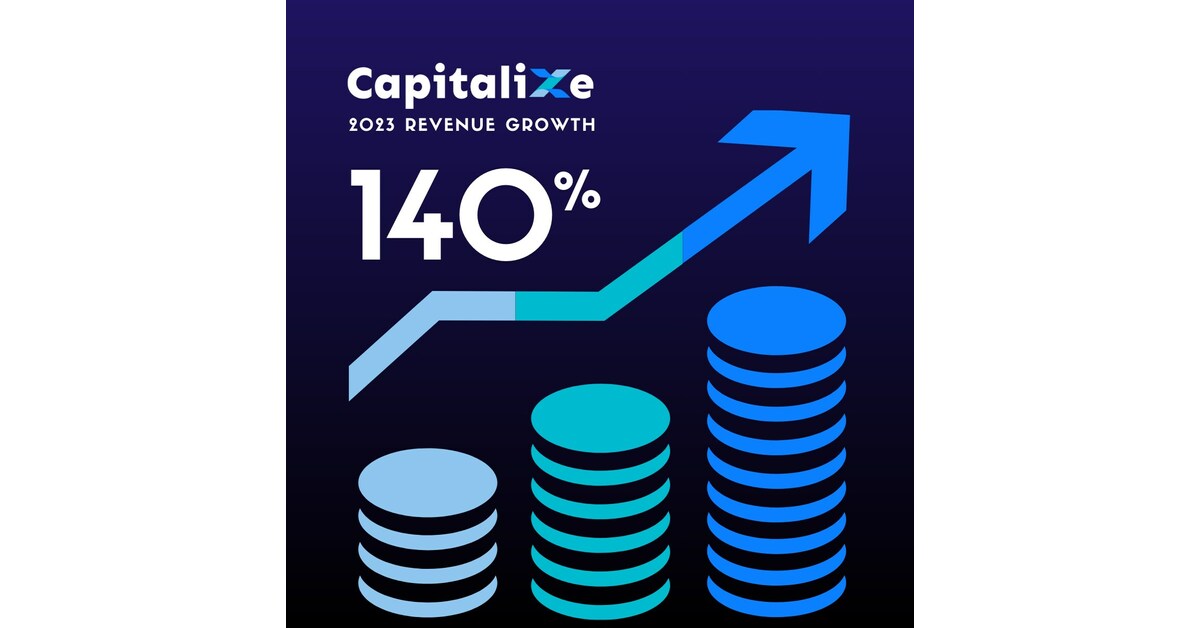
Capitalixe’s diversification into new services, including the introduction of new, cutting-edge financial technology, also played a pivotal role in its growth. The company experienced a 225% increase in engagement within the gambling and gaming industry and a 33% expansion in the crypto sector, showcasing its commitment to integrating the latest technological advancements. Entry into the luxury goods sector demonstrated Capitalixe’s strategic approach to exploring high-value industries, contributing significantly to revenue diversification and enhanced market adaptability.
Ivan Kovachev, Co-founder & CEO, and driving force behind Capitalixe’s technological advancements, underscored the role of innovation and technology in their growth. He said, “Innovation has been the cornerstone of our growth strategy. By utilising emerging technologies and fostering a culture of continuous learning, we’ve pushed the boundaries in fintech,” he explained. “Our plans to enter into emerging technologies will solidify our position as industry pioneers, ensuring Capitalixe remains a trusted partner for clients seeking cutting-edge solutions in financial services.”
The company eagerly anticipates sustained growth and adaptation in the dynamic financial technology landscape.
About Capitalixe
Capitalixe is a global fintech consultancy connected to a number of leading financial institutions and international payment providers, delivering the latest payments and banking solutions to corporate clients worldwide.
Media Contact
Lissele Pratt, Capitalixe, 44 0208 0888 035, [email protected], https://capitalixe.com/
SOURCE Capitalixe


NEW YORK, Feb. 20, 2024 /PRNewswire/ — Acquis Consulting Group (Acquis) recently announced the formation of the Acquis Foundation. Since its inception, the foundation has already pledged $600,000 toward social responsibility programs and initiatives, with plans to continue to seed exceptional and innovative programs, distributing more than $100,000 annually.
Acquis Consulting brings more than a decade of experience cultivating and strengthening partnerships with local nonprofit organizations. Acquis Foundation was established to expand on the desire of Acquis Consulting team members to creatively fill unmet needs across three key pillars: oncology prevention and research; diversity, equity, and inclusion; and direct service to local communities.
This work builds on a strong legacy partnership with American Cancer Society, while also incorporating more newly established partnerships with two DEI-focused nonprofits, Management Leadership for Tomorrow (MLT) and START Treatment and Recovery Centers. The foundation has also created a Direct Service internship program, which will provide a stipend and mentorship for students from disadvantaged backgrounds to participate in internships within nonprofit partner organizations.
“Acquis Foundation allows us to leverage our strategic expertise, collaborate with our partners, and develop an even greater and meaningful impact in the community,” says Joanna Sears, Acquis Foundation Board Member and Chief Operating Officer of Acquis Consulting Group.
In its inaugural year, the foundation distributed gifts in the form of direct donations to nonprofit partners, holiday toy drive gifts, school supplies, and through employee donation matching programs.
The foundation’s mission is to put people first, tapping into the passions and intellectual power of the Acquis team, to amplify the impact of its economic contributions. It aims to contribute and make an impact on causes that the Acquis family is passionate about, leveraging their strengths to help solve problems, bolster communities, and advance together.
About Acquis Consulting Group
Acquis, repeatedly named one of the ‘Best Small Firms to Work For’ by Consulting Magazine and recipient of many top workplace awards by Fortune/Great Place to Work, is a world class management consulting firm best known for helping ambitious organizations design strategies and putting those strategies to work. Founded in 1998, Acquis designs innovative solutions leveraging strategy, implementation, and digital services. For more information on Acquis, please visit www.acquisconsulting.com.
American Cancer Society
Hope Lodge
132 West 32nd Street, New York, NY 10001
Webpage: https://www.cancer.org/
Management Leadership for Tomorrow
7200 Wisconsin Ave. #200, Bethesda, MD 20814
Webpage: https://mlt.org/
Email: [email protected]
START Treatment & Recovery Centers
937 Fulton Street, Brooklyn, NY 11238
Webpage: https://www.startny.org/
Contact:
Joanna Sears
COO
Acquis Consulting
[email protected]
SOURCE Acquis Consulting

TALLAHASSEE, Fla., Feb. 13, 2024 /PRNewswire/ — PATLive, a leading provider of professional answering services for small businesses, is excited to announce an integration with Jobber, an award-winning operations management software for home service businesses. With this new service integration, PATLive and Jobber work together seamlessly, combining PATLive’s 24/7 answering service with Jobber’s all-in-one operations platform.
Home service businesses can now manage their PATLive leads and business tasks all in one place, reducing administrative work and saving time. Plus, PATLive’s skillful handling of calls and web chats fits perfectly with Jobber’s robust features like scheduling and client manager. The combination of PATLive and Jobber ensures a smooth and professional customer experience, less work for busy home service professionals, and peace of mind knowing no call goes unanswered. To learn more about how PATLive works with Jobber, see this article from PATLive.
Jackie Gonzalez, CEO of PATLive, shared her enthusiasm for the partnership and its early success, stating, “As a company, we’re always looking for ways to make running and growing a business easier for our customers. We’ve already received great feedback from our early users about how the new integration is saving them hours of administrative time each month. Stay tuned for our next version of the integration – currently in the works – which will bring even further benefits to our mutual customers. “
PATLive is also proud to sponsor the upcoming Jobber Summit (March 6, 2024), a free online event aimed at helping home service professionals connect with their community and get expert advice. Jobber Summit will cover topics such as growing your business, improving the customer experience, and the latest home service trends. The event offers two participation options to accommodate busy schedules — a morning session from 10:00 AM to 2:00 PM ET and an evening session from 6:00 PM to 10:00 PM ET. Attendees can hear from speakers including #1 New York Times Bestselling author James Clear and the host of ‘This Old House’ Kevin O’Connor. For more details about Jobber Summit and to register, visit jobber.com/summit.
About PATLive:
Since 1990, PATLive has been a leader in virtual receptionist services, providing 24/7/365 phone answering and web chat support for a fraction of the cost of hiring an in-house receptionist. The company’s team of highly trained US-based agents ensures businesses always make a great impression on customers and never miss a call. In 2023, Forbes named PATLive among the “Best Virtual Receptionist Services”, Business.com called it the “Best for Small Business”, and the company was recently featured in US News, highlighting their commitment to excellence in customer service.
About Jobber:
Jobber is an award-winning operations management platform for small home service businesses. Unlike spreadsheets or pen and paper, Jobber keeps track of everything in one place and automates day-to-day operations, so small businesses can run smoothly and provide five-star service at scale. Jobber is used by more than 200,000 home service professionals to serve over 27 million properties in more than 60 countries. The company continually ranks as one of Canada’s fastest-growing and most innovative companies by Canadian Business and Macleans, The Globe and Mail, Fast Company, and Deloitte. For more information visit: https://jobber.com/.
Visit PATLive on social media:
Facebook
Twitter
LinkedIn
SOURCE PATLive
