


Silicon Valley Bank, Signature Bank and First Republic Bank increased their outstanding borrowings from the Federal Home Loan Bank System by more than a third each shortly before failing, according to the Government Accountability Office.
The increase in borrowings is the subject of a
The GAO found that the three banks borrowed substantially more from the Home Loan Bank System than a group of their peers that included 16 commercial banks.
The report is the first in a series in which the GAO will look at broader issues related to the Home Loan Bank System. The private network of 11 regional, cooperative banks was created in 1932 after the Great Depression to serve as a source of funding for thrifts originating mortgages. The report was requested by House Financial Services Committee Chairman Patrick McHenry, R-N.C., and the panel’s ranking Democrat, Rep. Maxine Waters of California.
“GAO found the FHLBs of New York and San Francisco provided significant levels of advances to these banks compared to others, and that Signature Bank used FHLB advances to offset liquidity gaps it experienced related to crypto-related deposits,” Waters said last week in a press release. “Meanwhile, SVB was unable to reposition collateral quickly enough from its FHLB to the Fed’s discount window to access emergency liquidity.”
Starting on March 1, 2023, SVB increased its borrowings by 50% to $30 billion and then failed a week later. Signature’s borrowings rose 37% to $11.2 billion in the first two weeks of March before it failed that same month. And First Republic’s borrowings jumped 45% to $28.1 billion in the first two weeks of March before it failed in May, the GAO report found.
The GAO looked at the communication and coordination of the Home Loan banks with the Federal Deposit Insurance Corp. and Federal Reserve System — the failed banks’ primary federal regulators — and the repayment of the failed banks’ outstanding loans, known as advances, to the system.
“One of the main areas of focus is: Are the Federal Home Loan banks managing their relationships and their counterparty risk with institutions as they begin to fail, and do they have the right agreements and oversight in place with the Fed and others?” said Jim Parrott, co-owner of Parrott Ryan Advisors and a nonresident fellow at the Urban Institute. “When everything’s going 90 miles an hour, as an institution begins to take on water, are all of the relevant regulators and others who are in some sense indirectly responsible for taxpayer risks … coordinating?”
The GAO said that SVB failed before the Federal Home Loan Bank of San Francisco was able to request additional supervisory information from the Federal Reserve Bank of San Francisco. The New York and San Francisco Home Loan banks both were able to communicate with the FDIC about Signature and First Republic as those banks were declining, the GAO said.
“It was striking to me that [the Home Loan banks] kept lending to these failing banks until the very last week or days before they failed,” said Sharon Cornelissen, director of housing at the Consumer Federation of America and chair of the Coalition for FHLB Reform. “Only because the Federal Home Loan Bank of San Francisco does not lend over the weekend, SVB was frantically trying to gain access to the [Fed’s] discount window at the very last moment.”
The report was released several months after the Federal Housing Finance Agency’s review of the system. FHFA, the system’s regulator, released a
Teresa Bazemore, president and CEO of the San Francisco Home Loan Bank, said in an interview last week that it is important to understand what was happening ahead of the March 2023 liquidity crisis. Banks and credit unions were flush with record levels of deposits in 2021 from government stimulus programs in response to the pandemic. At that time, the Home Loan banks’ core business of providing liquidity to members
“Some of the money started to outflow from [member] banks at the same time those institutions had already invested some of that money. They’d already loaned it out, they’d already made mortgage loans [and] put them in their portfolios. They bought securities,” Bazemore said. “So if you compare where things were at the end of 2021 to the end of 2022, you saw our advances go up as a system because of that transfer of deposits out of the banks and credit unions. And that’s really what the system was set up for.”
The Federal Reserve hiked interest rates 11 times between 2022 and 2023 in an attempt to curb inflation. As a result, many banks were “upside down” and needed to borrow from the Home Loan Bank System, or alternatively, had to bring in brokered deposits, Bazemore said. Brokered deposits are typically made by companies with the assistance of a third party.
“If you’ve got a portfolio of 3% mortgage loans, where are you going to get the income to pay 4% or 5%, to compete with the money market [funds]?” Bazemore asked.
The GAO report also looked at the repayment of advances by the failed banks and whether there was a cost to the federal Deposit Insurance Fund. After regulators took aggressive steps last year to protect uninsured depositors, particularly venture capitalists after the failure of SVB,
The GAO report said that repayment “does not impose a direct cost” but that “research findings vary” regarding the risks that failed banks’ advances from the system pose to the DIF. Home Loan banks have a priority position ahead of the FDIC when a bank goes into receivership, an issue that has become a bone of contention among critics of the system.
The GAO said that in 2000 and 2005, respectively, studies by the Fed and FDIC noted that “FHLBanks’ priority position in receivership could subsidize member bank risk-taking, which could imply greater losses for the Deposit Insurance Fund.”
The GAO also said that a 2023 FHFA review of academic literature found that Home Loan banks’ regulatory policies and practices mitigate moral-hazard concerns, while a study by the Urban Institute last year found that an increase in a commercial bank’s use of advances reduces the odds of failure, particularly for a smaller bank.
Still, the report noted that “if proceeds of the failed bank’s liquidated assets do not cover claims eligible for the fund after repayment of FHLBank advances and any other secured claims, the Deposit Insurance Fund would incur costs.”
The GAO report also detailed the fees charged by both the San Francisco and New York Home Loan banks, which varied dramatically.
Bank failures may trigger prepayment fees that the Home Loan banks charge, which are required by the FHFA for certain products. Waiver fees also may be charged if a member-bank makes voluntary prepayments. The Home Loan banks also may waive the fees, or even charge the FDIC, as the receiver of a failed bank, a waiver fee to compensate for risks.
Prepayment penalties also vary depending on the length and terms of an advance. The FDIC typically pays off advances and incurs a fee in order to take the collateral that has been pledged by a commercial bank to a Home Loan bank.
After SVB failed, the FDIC transferred all its deposits and nearly all of its assets to Silicon Valley Bridge Bank, which repaid the $30 billion in outstanding advances to the San Francisco Home Loan Bank. The San Francisco bank received $266.5 million in prepayment fees and $18.8 million in waiver fees. Most of SVB’s advances had terms of one to three years.
“SVB did not have a particular stated strategy for borrowing advances in that maturity range,” the GAO said, citing officials from the San Francisco Home Loan Bank.
Meanwhile First Republic’s outstanding advances were assumed by JPMorgan Chase, which repaid roughly $5.8 billion in loans that had reached maturity, and has indicated that it plans to repay the remaining advances according to the advance terms.
In contrast, after Signature Bank failed, the Federal Home Loan Bank of New York also received full repayment for Signature’s $11.2 billion in outstanding advances but received just $260,000 in prepayment fees and no waiver fees.
“The broader discussion is whether this is the role that we want [the FHLBs] to play,” Cornelissen said. “According to the law they were within their rights to provide liquidity, but we should be more tightly regulating them because it’s not their place to be the lender of last resort. They are going to keep lending until the very last day because that’s their business model and presents no risk to them.”
Ryan Donovan, president and CEO of the Council of Federal Home Loan Banks, the system’s trade group, applauded the GAO report for finding that the system made efforts to coordinate with the Federal Reserve banks of New York and San Francisco in accordance with policies and procedures.
“We appreciate the findings in the GAO’s report, and we believe they validate what we have been saying for a year: that the FHLBanks acted as a critical shock absorber for the financial system during a period of unprecedented turbulence in the spring of 2023,” Donovan said. “The two most important takeaways from this report are that the FHLBanks provided crucial liquidity to their members in direct accordance with the structure and role laid out for them by Congress, and that the FHLBanks worked tirelessly in a coordinated fashion with primary financial regulators to ensure the safety and soundness of the U.S. banking system.”
The Federal Home Loan Bank System
The GAO report is dated March 8 but was released on April 8 after lawmakers and the Home Loan banks had a month to assess its findings.
by Calculated Risk on 3/27/2024 09:41:00 AM
Today, in the Calculated Risk Real Estate Newsletter: Inflation Adjusted House Prices 2.4% Below Peak
Excerpt:
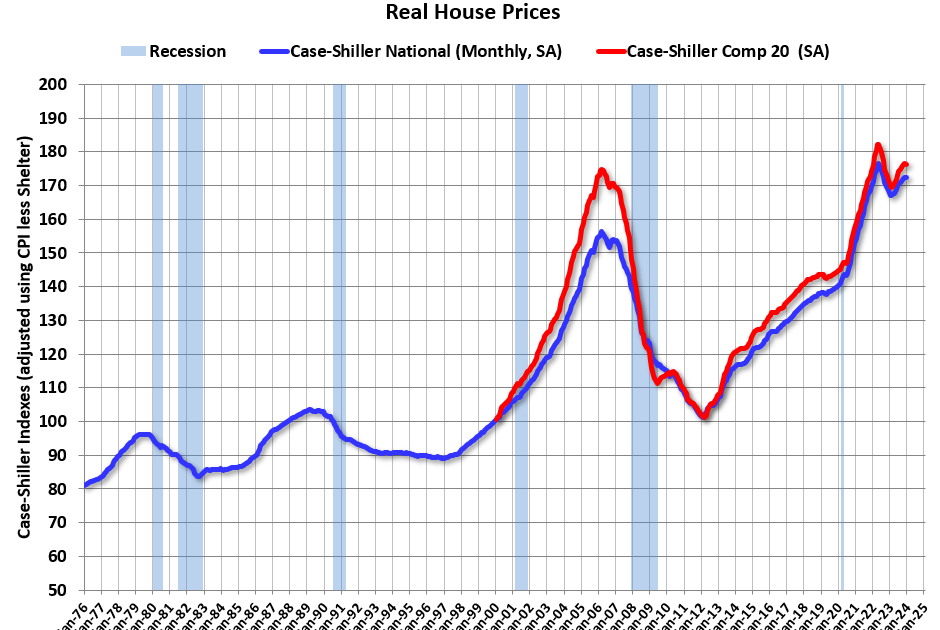
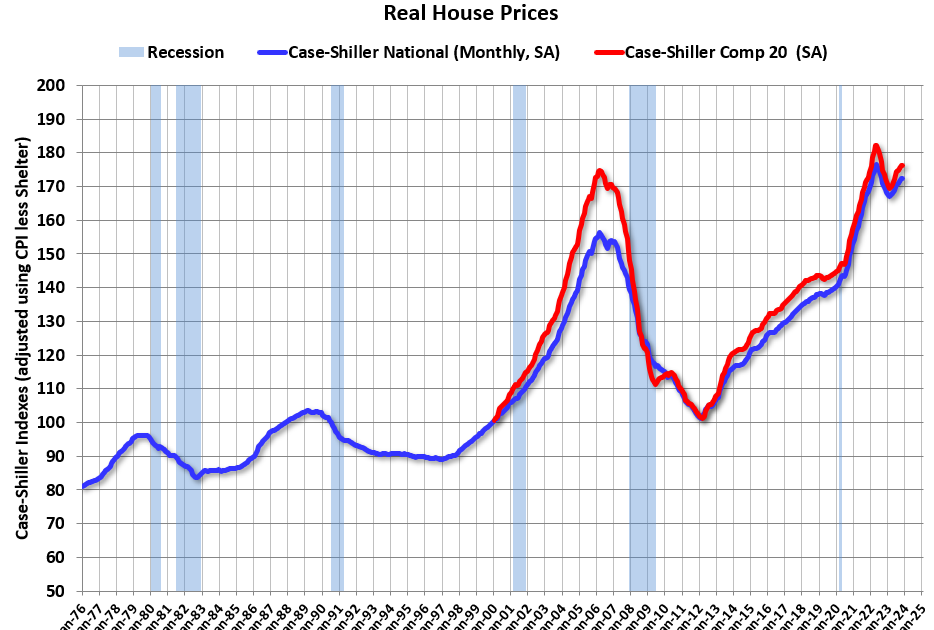
It has been over 17 years since the bubble peak. In the January Case-Shiller house price index released yesterday, the seasonally adjusted National Index (SA), was reported as being 71% above the bubble peak in 2006. However, in real terms, the National index (SA) is about 10% above the bubble peak (and historically there has been an upward slope to real house prices). The composite 20, in real terms, is 1% above the bubble peak.
People usually graph nominal house prices, but it is also important to look at prices in real terms. As an example, if a house price was $300,000 in January 2010, the price would be $427,000 today adjusted for inflation (42% increase). That is why the second graph below is important – this shows “real” prices.
The third graph shows the price-to-rent ratio, and the fourth graph is the affordability index. The last graph shows the 5-year real return based on the Case-Shiller National Index
…The second graph shows the same two indexes in real terms (adjusted for inflation using CPI).
In real terms (using CPI), the National index is 2.4% below the recent peak, and the Composite 20 index is 3.3% below the recent peak in 2022. Both indexes were mostly flat in January in real terms.
In real terms, national house prices are 10.2% above the bubble peak levels. There is an upward slope to real house prices, and it has been over 17 years since the previous peak, but real prices are historically high.

There is much more in the article.
by Calculated Risk on 3/26/2024 01:00:00 PM
Two key points:
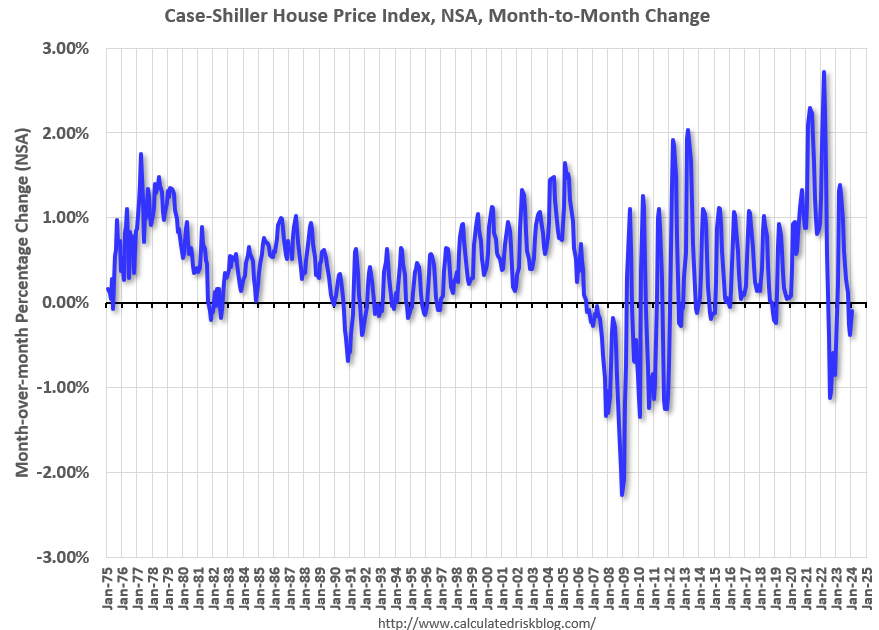
1) There is a clear seasonal pattern for house prices.
2) The surge in distressed sales during the housing bust distorted the seasonal pattern. This was because distressed sales (at lower price points) happened at a steady rate all year, while regular sales followed the normal seasonal pattern. This made for larger swings in the seasonal factor during the housing bust.

Click on graph for larger image.
This graph shows the month-to-month change in the NSA Case-Shiller National index since 1987 (through January 2024). The seasonal pattern was smaller back in the ’90s and early ’00s and increased once the bubble burst.
The seasonal swings declined following the bust, however the pandemic price surge changed the month-over-month pattern.
 The second graph shows the seasonal factors for the Case-Shiller National index since 1987. The factors started to change near the peak of the bubble, and really increased during the bust since normal sales followed the regular seasonal pattern – and distressed sales happened all year.
The swings in the seasonal factors were decreasing following the bust but have increased again recently – this time without a surge in distressed sales.
Using the 2018 and 2019 seasonal factors, the Seasonally Adjusted Case-Shiller index would have declined slightly in January instead of increasing 0.4% month-over-month.

by Calculated Risk on 3/26/2024 09:00:00 AM
S&P/Case-Shiller released the monthly Home Price Indices for January (“January” is a 3-month average of November, December and January closing prices).
This release includes prices for 20 individual cities, two composite indices (for 10 cities and 20 cities) and the monthly National index.
From S&P S&P CoreLogic Case-Shiller Index Continues to Trend Upward in January 2024
The S&P CoreLogic Case-Shiller U.S. National Home Price NSA Index, covering all nine U.S. census divisions, reported a 6.0% annual gain in January, up from a 5.6% rise in the previous month. The 10-
City Composite showed an increase of 7.4%, up from a 7.0% increase in the previous month. The 20-
City Composite posted a year-over-year increase of 6.6%, up from a 6.2% increase in the previous
month. San Diego again reported the highest year-over-year gain among the 20 cities with an 11.2%
increase in January, followed by Los Angeles, with an increase of 8.6%. Portland, though holding the
lowest rank after reporting the smallest year-over-year growth, retained an upward trend with a 0.9%
increase this month.
…
The U.S. National Index and the 20-City Composite showed a continued decrease of 0.1%, and 10-City
Composite remained unchanged in January.After seasonal adjustment, the U.S. National Index, the 20-City Composite, and the 10-City Composite
all posted month-over-month increases of 0.4%, 0.1%, and 0.2% respectively.“U.S. home prices continued their drive higher,” says Brian D. Luke, Head of Commodities, Real &
Digital Assets at S&P Dow Jones Indices. “Our National Composite rose by 6% in January, the fastest
annual rate since 2022. Stronger gains came from our 10- and 20-City Composite indices, rising 7.4%
and 6.6%, respectively. For the second consecutive month, all cities reported increases in annual
prices, with San Diego surging 11.2%. On a seasonal adjusted basis, home prices have continued to
break through previous all-time highs set last year”
emphasis added
 Click on graph for larger image.
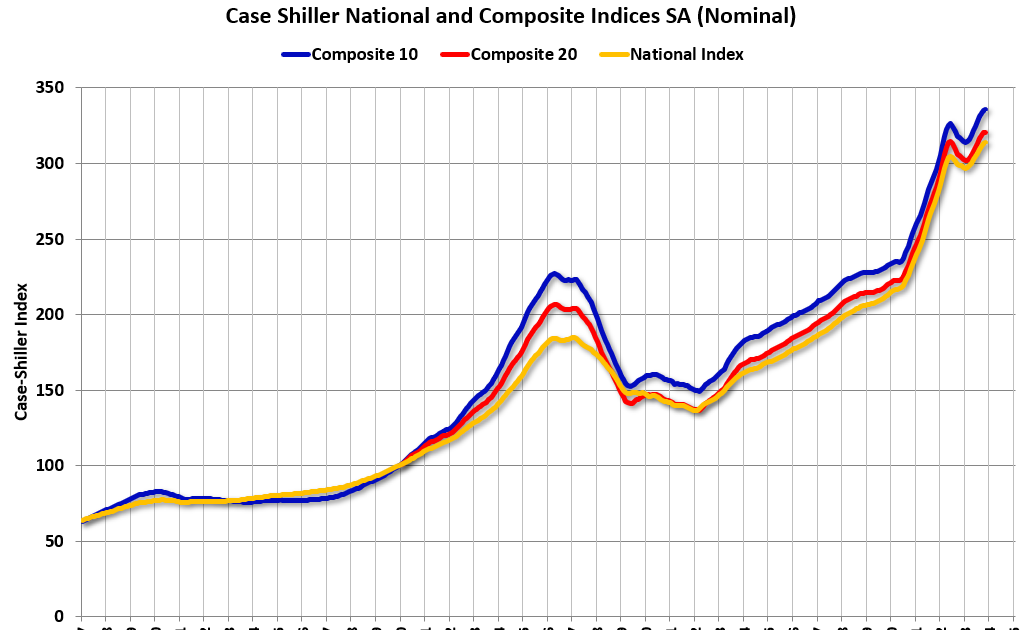
The first graph shows the nominal seasonally adjusted Composite 10, Composite 20 and National indices (the Composite 20 was started in January 2000).
The Composite 10 index is up 0.2% in January (SA). The Composite 20 index is up 0.1% (SA) in January.
The National index is up 0.4% (SA) in January.
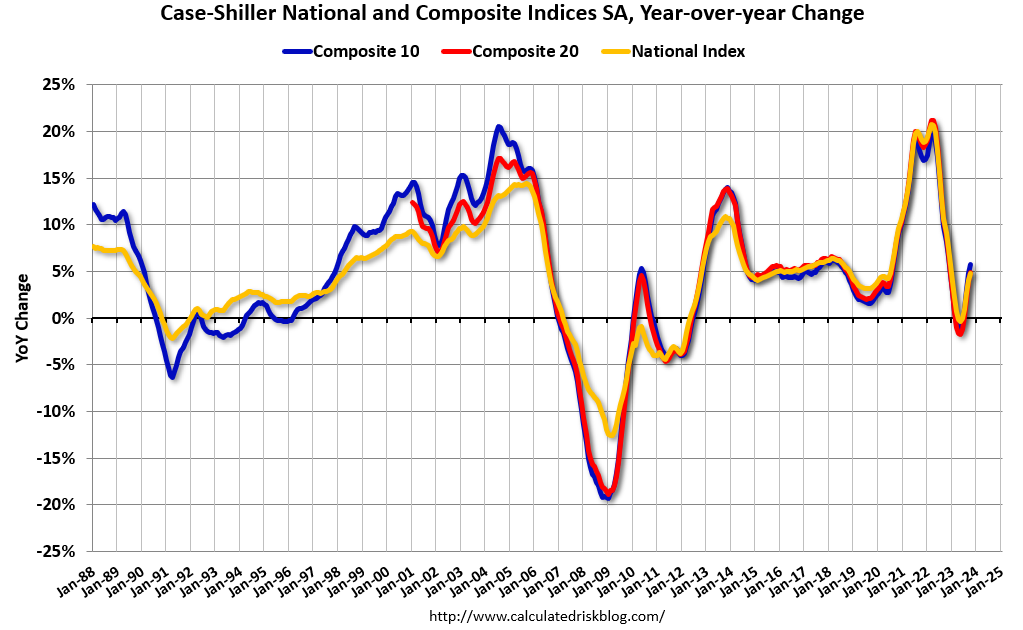
 The second graph shows the year-over-year change in all three indices.
The Composite 10 SA is up 7.4% year-over-year. The Composite 20 SA is up 6.6% year-over-year.
The National index SA is up 6.0% year-over-year.
Annual price changes were at expectations. I’ll have more later.
by Calculated Risk on 3/05/2024 11:41:00 AM
Today, in the Calculated Risk Real Estate Newsletter: Inflation Adjusted House Prices 2.4% Below Peak
Excerpt:
It has been over 17 years since the bubble peak. In the December Case-Shiller house price index released last week, the seasonally adjusted National Index (SA), was reported as being 70% above the bubble peak in 2006. However, in real terms, the National index (SA) is about 10% above the bubble peak (and historically there has been an upward slope to real house prices). The composite 20, in real terms, is 1% above the bubble peak.
People usually graph nominal house prices, but it is also important to look at prices in real terms. As an example, if a house price was $300,000 in January 2010, the price would be $426,000 today adjusted for inflation (42% increase). That is why the second graph below is important – this shows “real” prices.
The third graph shows the price-to-rent ratio, and the fourth graph is the affordability index. The last graph shows the 5-year real return based on the Case-Shiller National Index.
…In real terms (using CPI), the National index is 2.4% below the recent peak, and the Composite 20 index is 3.2% below the recent peak in 2022. Both indexes declined slightly in December in real terms.
In real terms, national house prices are 10.2% above the bubble peak levels. There is an upward slope to real house prices, and it has been over 17 years since the previous peak, but real prices are historically high.
There is much more in the article.
by Calculated Risk on 2/27/2024 09:00:00 AM
S&P/Case-Shiller released the monthly Home Price Indices for December (“December” is a 3-month average of October, November and December closing prices).
This release includes prices for 20 individual cities, two composite indices (for 10 cities and 20 cities) and the monthly National index.
From S&P S&P CoreLogic Case-Shiller Index Reports 5.5% Annual Home Price Gain for Calendar 2023
The S&P CoreLogic Case-Shiller U.S. National Home Price NSA Index, covering all nine U.S. census divisions, reported a 5.5% annual gain in December, up from a 5.0% rise in the previous month. The
10-City Composite showed an increase of 7.0%, up from a 6.3% increase in the previous month. The
20-City Composite posted a year-over-year increase of 6.1%, up from a 5.4% increase in the previous
month. San Diego reported the highest year-over-year gain among the 20 cities with an 8.8% increase
in December, followed by Los Angeles and Detroit, each with an 8.3% increase. Portland showed a
0.3% increase this month, holding the lowest rank after reporting the smallest year-over-year growth.
…
The U.S. National Index showed a continued decrease of 0.4%, while the 20-City Composite and 10-
City Composite posted 0.3% and 0.2% month-over-month decreases respectively in December.After seasonal adjustment, the U.S. National Index, the 20-City Composite, and the 10-City Composite
all posted month-over-month increases of 0.2%.“U.S. home prices faced significant headwinds in the fourth quarter of 2023,” says Brian D. Luke, Head
of Commodities, Real & Digital Assets at S&P Dow Jones Indices. “However, on a seasonally adjusted
basis, the S&P Case-Shiller Home Price Indices continued its streak of seven consecutive record highs
in 2023. Ten of 20 markets beat prior records, with San Diego registering an 8.9% gain and Las Vegas
the fastest rising market in December, after accounting for seasonal impacts.”“2023 U.S. housing gains haven’t followed such a synchronous pattern since the COVID housing boom.
The term ‘a rising tide lifts all boats’ seems appropriate given broad-based performance in the U.S.
housing sector. All 20 markets reported yearly gains for the first time this year, with four markets rising
over 8%. Portland eked out a positive annual gain after 11 months of declines. Regionally, the Midwest
and Northeast both experienced the greatest annual appreciation with 6.7%.”
 Click on graph for larger image.
The first graph shows the nominal seasonally adjusted Composite 10, Composite 20 and National indices (the Composite 20 was started in January 2000).
The Composite 10 index is up 0.2% in December (SA) and is at a new all-time high.
The Composite 20 index is up 0.2% (SA) in December and is also at a new all-time high.
The National index is up 0.2% (SA) in December and is also at a new all-time high.
 The second graph shows the year-over-year change in all three indices.
The Composite 10 SA is up 7.0% year-over-year. The Composite 20 SA is up 6.1% year-over-year.
The National index SA is up 5.5% year-over-year.
Annual price changes were at expectations. I’ll have more later.
by Calculated Risk on 2/04/2024 09:04:00 AM
On Friday, the BEA released their estimate of vehicle sales for January.
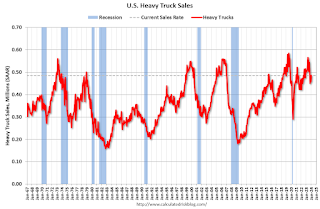
This graph shows heavy truck sales since 1967 using data from the BEA. The dashed line is the January 2024 seasonally adjusted annual sales rate (SAAR).
Heavy truck sales really collapsed during the great recession, falling to a low of 180 thousand SAAR in May 2009. Then heavy truck sales increased to a new record high of 570 thousand SAAR in April 2019.
 Click on graph for larger image.
Note: “Heavy trucks – trucks more than 14,000 pounds gross vehicle weight.”
Heavy truck sales declined sharply at the beginning of the pandemic, falling to a low of 308 thousand SAAR in May 2020.
Heavy truck sales were at 485 thousand SAAR in January, up from 458 thousand in December, and down 3.1% from 501 thousand SAAR in January 2023.
Usually, heavy truck sales decline sharply prior to a recession. Heavy truck sales are solid.
 The second graph shows light vehicle sales since the BEA started keeping data in 1967. Vehicle sales were at 15.00 million SAAR in January, down 6.9% from 16.12 million in December, and down 0.7% from 15.11 million in January 2023.Vehicle sales are usually a transmission mechanism for Federal Open Market Committee (FOMC) policy, although far behind housing. This time vehicle sales were more suppressed by supply chain issues than Fed rate hikes.
by Calculated Risk on 2/01/2024 12:37:00 PM
Today, in the Calculated Risk Real Estate Newsletter: https://calculatedrisk.substack.com/p/inflation-adjusted-house-prices-23-56a
Excerpt:
It has been over 17 years since the bubble peak. In the November Case-Shiller house price index released yesterday, the seasonally adjusted National Index (SA), was reported as being 70% above the bubble peak in 2006. However, in real terms, the National index (SA) is about 10% above the bubble peak (and historically there has been an upward slope to real house prices). The composite 20, in real terms, is 1% above the bubble peak.
People usually graph nominal house prices, but it is also important to look at prices in real terms. As an example, if a house price was $300,000 in January 2010, the price would be $425,000 today adjusted for inflation (41.5% increase). That is why the second graph below is important – this shows “real” prices.
The third graph shows the price-to-rent ratio, and the fourth graph is the affordability index. The last graph shows the 5-year real return based on the Case-Shiller National Index.
…The second graph shows the same two indexes in real terms (adjusted for inflation using CPI).
In real terms (using CPI), the National index is 2.3% below the recent peak, and the Composite 20 index is 3.2% below the recent peak in 2022.
In real terms, national house prices are 10.4% above the bubble peak levels. There is an upward slope to real house prices, and it has been over 17 years since the previous peak, but real prices are historically high.

There is much more in the article.
by Calculated Risk on 1/30/2024 09:00:00 AM
S&P/Case-Shiller released the monthly Home Price Indices for November (“November” is a 3-month average of September, October and November closing prices).
This release includes prices for 20 individual cities, two composite indices (for 10 cities and 20 cities) and the monthly National index.
From S&P S&P CoreLogic Case-Shiller Index Upward Trend Decelerates in November
The S&P CoreLogic Case-Shiller U.S. National Home Price NSA Index, covering all nine U.S. census divisions, reported a 5.1% annual gain in November, up from a 4.7% rise in the previous month. The
10-City Composite showed an increase of 6.2%, up from a 5.7% increase in the previous month. The
20-City Composite posted a year-over-year increase of 5.4%, up from a 4.9% increase in the previous
month. Once again, Detroit reported the highest year-over-year gain among the 20 cities with an 8.2%
increase in November, followed again by San Diego with an 8% increase. For the third month in a row,
Portland fell 0.7% and remained the only city reporting lower prices in November versus a year ago.
…
For the first time since January 2023, the U.S. National Index and 20-City Composite posted 0.2%
month-over-month decreases in November, while the 10-City Composite posted a 0.1% decrease.After seasonal adjustment, the U.S. National Index and the 10-City Composite posted month-overmonth increases of 0.2%, while the 20-City Composite posted a month-over-month increase of 0.1%.
“U.S. home prices edged downward from their all-time high in November,” says Brian D. Luke, Head of
Commodities, Real & Digital Assets at S&P DJI. “The streak of nine monthly gains ended in November,
setting the index back to levels last seen over the summer months. Seattle and San Francisco reported
the largest monthly declines, falling 1.4% and 1.3%, respectively.”“November’s year-over-year gain saw the largest growth in U.S. home prices in 2023, with our National
Composite rising 5.1% and the 10-city index rising 6.2%. Detroit held its position as the best performing
market for the third month in a row, accelerating to an 8.2% gain. San Diego notched an 8% annual
gain, retaining its second spot in the nation. Barring a late surge from another market, those cities will
vie for the ‘housing market of the year’ as the best performing city in our composite.”“Six cities registered a new all-time high in November (Miami, Tampa, Atlanta, Charlotte, New York,
and Cleveland). Portland remains the lone market in annual decline. The Northeast and Midwest
recorded the largest gains with returns of 6.4% and 6.3%, respectively. Other regions are not far behind
with the slowest gains in the West of 3%. This month’s report revealed the narrowest spread of
performance across the nation since the first quarter of 2021.”
 Click on graph for larger image.
The first graph shows the nominal seasonally adjusted Composite 10, Composite 20 and National indices (the Composite 20 was started in January 2000).
The Composite 10 index is up 0.2% in November (SA) and is at a new all-time high.
The Composite 20 index is up 0.1% (SA) in November and is also at a new all-time high.
The National index is up 0.2% (SA) in November and is also at a new all-time high.
 The second graph shows the year-over-year change in all three indices.
The Composite 10 SA is up 6.2% year-over-year. The Composite 20 SA is up 5.4% year-over-year.
The National index SA is up 5.1% year-over-year.
Annual price changes were below expectations. I’ll have more later.
by Calculated Risk on 1/27/2024 08:11:00 AM
The key reports scheduled for this week are the January employment report and November Case-Shiller house prices.
Other key indicators include the January ISM manufacturing index and January vehicle sales.
The FOMC meets this week, and no change to policy is expected.
—– Monday, January 29th —–
10:30 AM: Dallas Fed Survey of Manufacturing Activity for January. This is the last of the regional Fed manufacturing surveys for January.
—– Tuesday, January 30th —–
9:00 AM: FHFA House Price Index for November. This was originally a GSE only repeat sales, however there is also an expanded index.
 9:00 AM ET: S&P/Case-Shiller House Price Index for November.
This graph shows the Year over year change in the nominal seasonally adjusted National Index, Composite 10 and Composite 20 indexes through the most recent report (the Composite 20 was started in January 2000).
The consensus is for a 5.8% year-over-year increase.
 10:00 AM ET: Job Openings and Labor Turnover Survey for December from the BLS.
This graph shows job openings (black line), hires (purple), Layoff, Discharges and other (red column), and Quits (light blue column) from the JOLTS.
Jobs openings decreased in November to 8.79 million from 8.85 million in October.
10:00 AM: The Q4 Housing Vacancies and Homeownership report from the Census Bureau.
—– Wednesday, January 31st —–
7:00 AM ET: The Mortgage Bankers Association (MBA) will release the results for the mortgage purchase applications index.
8:15 AM: The ADP Employment Report for January. This report is for private payrolls only (no government). The consensus is for 130,000 payroll jobs added in January, down from 164,000 added in December.
9:45 AM: Chicago Purchasing Managers Index for January. The consensus is for a reading of 48.0, up from 46.9 in December.
2:00 PM: FOMC Meeting Announcement. No change to policy is expected.
2:30 PM: Fed Chair Jerome Powell holds a press briefing following the FOMC announcement.
—– Thursday, February 1st —–
8:30 AM: The initial weekly unemployment claims report will be released. The consensus is for 210 thousand initial claims, down from 214 thousand last week.
10:00 AM: Construction Spending for December. The consensus is for a 0.5% increase in construction spending.
10:00 AM: ISM Manufacturing Index for January. The consensus is for the ISM to be at 47.3, down from 47.4 in December.
—– Friday, February 2nd —–
 8:30 AM: Employment Report for December. The consensus is for 162,000 jobs added, and for the unemployment rate to increase to 3.8%.
There were 216,000 jobs added in December, and the unemployment rate was at 3.7%.
This graph shows the jobs added per month since January 2021.
10:00 AM: University of Michigan’s Consumer sentiment index (Preliminary for January).
 All day: Light vehicle sales for January. Sales were at 15.8 million in December (Seasonally Adjusted Annual Rate).
This graph shows light vehicle sales since the BEA started keeping data in 1967. The dashed line is the December sales rate.