

Are home prices about to fall?
That’s the question many of us are asking after the National Association of Realtors, the trade group representing the industry, agreed to cough up $418 million as part of an antitrust lawsuit alleging that the group had artificially inflated realtor commissions that home sellers pay — which, in turn, helped inflate home prices.
Until now, home sellers paid about 6 percent of the sale price toward a fee that would be split between their own agent and the buyer’s agent. Experts are divided on exactly how much impact this will have on home buyers, who will now likely have to start paying their agents themselves. The median sale price of homes as of late 2023 was about $417,700 — 6 percent of that amounts to a little over $25,000.
As Business Insider’s James Rodriguez noted, lower fees don’t automatically mean homes will be cheaper. In certain cases, it’s possible that sellers might list their home for the same price they would have before the settlement, and pocket more of the sale. But lower commission fees can also encourage more homeowners to list their property on the market, which could lower house prices overall.
The fact is, this real estate settlement is still too new for anyone to know for sure what the ripple effects will be. But one potential winner is tech companies in the real estate space, such as Zillow and Redfin, which have made it more feasible for people to start the home-buying process on their own instead of with a real estate agent. Vox spoke to Sonia Gilbukh, a real estate professor at City University of New York, Baruch College, to explore some of the possible outcomes.
The following conversation has been edited for length and clarity.
What was the problem with the old way realtor commissions worked? And how does this settlement change that?
It used to be that when a seller hired their agent to list a property for sale, they were paying the full commission for the transaction, which was approximately 6 percent — sometimes 5 and a half. The selling agent would then offer about half of that commission to the buyer’s side. Then the buyer’s agent will bring their clients to show all the properties, and if they end up buying the house, [the buyer’s agent] would be entitled to that commission that the seller agent was advertising for the property.
There were several rules that were part of the NAR settlement. Can you explain the new rule that sellers can’t advertise buyer agents’ commissions on the multiple listing service, or MLS, the portal that many realtors subscribe to in order to share and receive information about for-sale homes?
Yes, so the settlement is that they can no longer say, “I’m going to offer the buyer agent 3 percent,” for example, or 2.5 percent. So now, what happens is that the buyer’s agent basically would have no way to know whether they’re going to be paid for the work that they do. So something will have to change. Most likely, the buyer agents will have to directly negotiate with the buyer on the commission that they’re going to receive on a transaction.
Is it still possible that the seller’s agent would pay the buyer agent’s fee?
I think if they really wanted to, they could still post it on their website — there are ways to communicate that. But I think it would be harder to sell that as an industry standard, to the seller. Because the way it worked before is that the selling agent would say, “If you want to sell your house, we have to offer the buyer agent 3 percent, the industry standard. If we don’t, then the buyer agents are not going to show your house to their clients and you’re not going to be able to sell.” Now I feel like it would be harder to make that argument.
I’m guessing that new ways of compensating buyer agents will emerge — maybe some flat fee services, or they’ll negotiate to get paid a percentage of the deal but out of the buyer’s pocket. I don’t think they’re going to be able to keep the status quo.
I’ve been seeing in various reports that the old system, of the seller paying both agents, incentivized a practice called “steering.” Can you explain what that is, and is it really common?
Steering is a practice where the buying agent will not show, or discourage their buyers from properties that offer lower commissions.
Maisy Wong, Panle Jia Barwick, and Parag Pathak have a paper called Conflicts of Interest and Steering in Residential Brokerage, and they show that when buyer agents are offered less than the industry standard, the homes have more trouble selling. That’s basically their conclusion, that the buyer agents are steering their clients away from homes that offer lower commissions to them. I think there’s some potentially alternative explanations — if you offer less commission than the standard, maybe you’re particularly hard to deal with, difficult to negotiate with. But we certainly do see that in the data, that if you’re offering less than the standard, you were potentially jeopardizing your sale outcomes.
The plaintiffs for this lawsuit were home sellers. Beyond lower fees, what does this mean for sellers? Are there other benefits for them?
Well, we don’t know what’s going to happen, but let’s say that they’re no longer responsible for the buyer commission, then the sellers are going to be paying a 3 percent transaction cost. Now, of course, most people who sell their house also then buy a different house — so they’re still going to be paying the buyer commission on the new house that they buy.
I think what’s going to come out of this decoupling of the commission — that the buyer is going to pay for their agent, the seller’s going to pay for their agent — is that the commissions are going to become more negotiable.
And what will happen for buyers? Will some of them forgo hiring a realtor at all? Will the process of searching for a home look different?
I was talking to my mother-in-law, who is a real estate agent, and she actually owned a brokerage before. She was telling me that she views buyers to be in one of two categories: Either you’re a first-time buyer, or you’re somebody who’s selling their house and also buying something else. Those who are selling and then buying, they probably have a relationship with their agents, they probably want their agents to help them buy. So it could be a similar scenario of the status quo for them, with the possibility of maybe shaving a little bit more off the commission.
For new buyers, I think the option of paying a flat fee is going to be more attractive, because it’s going to be cheaper for them to pay a flat fee of, say, $2,000 for you to help me navigate the paperwork or something like that.
Will this mean that home prices fall?
I think eventually, if the transaction costs are going to fall, because the commissions are going to become cheaper and more negotiable. That will put a downward pressure on houses — I also think that will bring more people to sell their homes, because the transaction fee falls, people are going to be more likely to move.
I see. But you said “eventually,” so it’s not necessarily something we might see right away.
Yeah, I think it’s hard to know what’s going to happen — how buyer agents are going to be compensated, and [if] we still have buyer agents at all. We’re in this period of murky transition. For now, it’s pretty easy to sell because there’s just not a lot of inventory. But there’s not a lot of transactions actually happening.
I’m curious why we used this structure in the first place. Why have sellers typically paid both selling and buying agents?
It became the industry standard [in a period when] we had no information out there. We didn’t have Zillow. So buyer agents had a monopoly on information; if I’m not compensated as a buyer agent, or if my compensation is uncertain, then I’m going to only show [clients] the listings where I’m also the seller agent. When the commission structure changed, it improved the cooperation between agents, so they ended up showing their clients listings from other agencies. So that was actually really good.
But of course, now we have Zillow. And the potential for [buyer agents] to steer their clients only to their listings is very limited right now. There’s sort of no need for this system anymore.
Since commissions have historically been paid as a percentage of the sale, did that incentivize agents to show more expensive listings?
For the selling side, they have the incentive to sell at the highest price, essentially. But when you talk to agents, their main objective is to have the transaction happen in the first place. If they put the price too high, they risk the transaction not happening at all, then it’s not really a good trade-off. There’s also this thinking that the big houses sort of subsidize the salaries of the agents, who then also work with cheaper homes.
Some experts seem to think that this settlement will mean some real estate agents exit the industry. Do you think that’s likely? And if there are fewer realtors, is that good or bad for home buyers?
I think that’s very likely. I think most new people who come into the profession start out as buying agents, so if their compensation is going to fall, it’s not going to be worth it for them to enter anymore.
I do think it’s a good thing overall. I actually have a paper, with my co-author Paul Goldsmith-Pinkham, about the experience of real estate agents, and we find that over a quarter of all agents in the market have no experience at all. I think those are the people most likely to exit. As a result, we’re going to have more experienced real estate intermediaries, and more competitive pricing. So I do think it’s overall a good thing for consumers.
What’s the housing market like right now? Is it a seller’s market or a buyer’s market?
I think it’s still a seller’s market, but it’s sort of artificial, because we still have pretty low inventory. So yes, houses are selling quickly, but mostly because there aren’t a lot of homes for sale. Once we’re past this lock-in period — right now, most of the homes have been sold on really low mortgage rates, so it’s hard for sellers to sell and buy something new, because mortgage rates are so much higher. But eventually people will start moving, and eventually they’ll be paying off their loans. So maybe eventually the [mortgage] rates will also drop.
What else is possible in terms of reform and change in the real estate industry?
They could just straight-up outlaw sellers paying buyer commissions — but the current settlement essentially all but does that.
Are there reasons other than the long-term possibility of lower home prices for sellers and buyers to get excited about this settlement? Just how important is it?
I think it’s important. I think there’s going to be more experienced agents out there to represent buyers and sellers. I think the prices are going to drop — a little or a lot, we don’t know yet — but I think they’ll have to adjust. I think there’s going to be more people willing to move homes because the transaction cost of doing that is going to be lower.
The point you make about more homes just being on the market — that seems huge, because as you said before, one of the biggest roadblocks we’re facing is low inventory.
Yes, yeah.
I do want to say that, even though I’ve done extensive research on inexperienced agents, I do think that experienced professionals are really valuable. People should seek help, because [buying a property] is the most important transaction in their lives, probably.
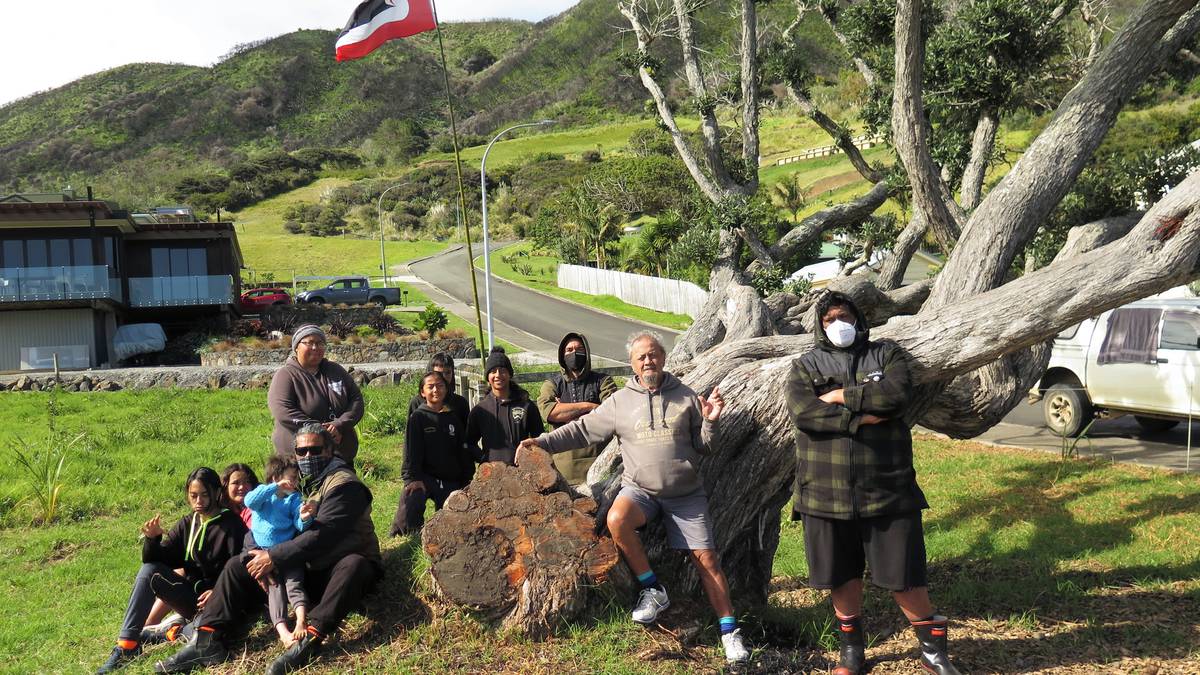
Occupiers moved on to a property on Ahipara’s Wharo Way in October 2021, after a significant pohutukawa tree they believed had been protected by being placed in a reserve was not protected at all.
Kaitāia GP Cecil Williams is thinking about leaving the town after 35 years, after being “forced” to sell his property, which had been occupied by a local iwi, for about $130,000 less than its Quotable Value.
Williams’ property at 1 Wharo Way, Ahipara, was first occupied in October 2021 by members of Te Rarawa who were unhappy that a culturally significant pōhutukawa on the property had been partly felled for a house site.
The iwi members were angry because they were led to believe the tree had been included in a reserve at the front of the land when it was subdivided. However, the reserve was later made smaller and the tree included in the property at 1 Wharo Way that the Williamses bought.
The iwi members felt betrayed over what were assurances the culturally significant site at Ahipara would be fully protected as a public reserve.
AdvertisementAdvertise with NZME.
Williams said he and his wife, Marna, checked when they bought the section that there were no land claims or any other issues with it, and after being assured there were none, bought it for $500,000. The tree was not listed as protected or significant on the council’s website.
He said they were the innocent parties in the debacle and had done nothing wrong, yet were seriously out of pocket due to no actions of their own.
The land was occupied for almost a year before Far North District Council, in an effort to solve the impasse, agreed to buy the land from the Williamses.
At its August meeting where it agreed to buy the land, Kahika/Mayor Moko Tepania acknowledged that historic actions had seen undertakings to protect 1 Wharo Way broken. While the council would never be a default Office of Treaty Settlements, it had acknowledged there were special circumstances that led to the motion for council to negotiate the purchase of the land supported, he said.
AdvertisementAdvertise with NZME.
Williams said the couple were caught in a fait accompli as they had to sell the land to the council because nobody else would buy a property that was being occupied and under such dispute.
“Who would buy land that was being occupied and nothing was being done to move the occupiers off?”

The couple are angry and upset that they had to settle with the council for $437,500 for the land when the QV valuation a year earlier was for $560,000, and feel they had no choice but to sell, given that nobody else would buy it.
At the start of the occupation, Williams offered to sell the land to Te Rarawa, or the council for the $500,000 they paid for it, and is now upset they are out of pocket by so much.
“It’s prime waterfront land, but the council’s independent valuation in September last year said it was only worth $400,000. Yet the council’s own Quotable Value in October the year before said the property was worth $560,000. I know prices have dropped a bit, but I can’t see how such a piece of coastal land has dropped by $160,000 in a year. That’s hard to take.”
FNDC has been approached for comment, but had not responded by publishing time.
Williams said the property was to be where they built their dream home to retire, but after 35 years as a GP in Kaitāia, the saga had left such a sour taste that they were seriously considering selling up their other property and moving away.
“It’s hard enough as it is to get GPs up here, but this has really hit us hard. The stress and the anxiety this has caused us, the sleepless nights and worry have been unbearable. Through no fault of our own we have now had to take a huge financial hit, and I’m upset that after all these years helping this community, we’ve had such little support and are seen as the bad guys.”
He said they were not aware the pōhutukawa was supposed to be protected or that it was supposed to have been on a reserve; had they known, they would not have bought the land in the first place.
Williams acknowledged he had stopped paying rates on the land from when the occupiers moved in because he was unable to use the land, and neither the council nor police would move the protesters off. The roughly $8000 outstanding rates were paid from the property sale price to the council.
AdvertisementAdvertise with NZME.
Mike Dinsdale is the editor of the Northland Age who also covers general news for the Advocate. He has worked in Northland for almost 34 years and loves the region.

Residential property investors took out $894 million of new bank loans in December – the lowest amount for a December month since at least 2014. Photo / Mark Meredith
The change of government wasn’t enough to get investors rushing back into the residential property market – in December at least.
Residential property investors took out $894 million of new bank loans during the month.
AdvertisementAdvertise with NZME.
AdvertisementAdvertise with NZME.

Bert Potter (front) and residents of the Centrepoint Community in Albany. Photo / Supplied
A multimillion-dollar Auckland property that was the site of New Zealand’s most infamous commune, Centrepoint, has been withdrawn from sale without finding a buyer.
The huge site in the city’s north has a council valuation of almost $9 million and had been billed as “one of the last significant underdeveloped landholdings on the fringe of Albany”.
It also has a dark history as it was where Bert Potter served as the spiritual head of the Centrepoint commune.
Potter was arrested in 1990 for sexual abuse and drugs crime, with survivors sharing stories of life in the commune in the acclaimed documentary, Heaven and Hell – The Centrepoint Story, in 2021. Many of them had been exploited as children by adults living at the commune.
AdvertisementAdvertise with NZME.
The commune was shut in 2000 and Potter died in 2012, aged 86.
Since then, the property at 14 Mills Lane has been run as a wellness and retreat centre, before being put up for sale and marketed last year as a big development opportunity.
However, agent Michael Nees, from Bayleys North Shore Commercial, said the property did not get a buyer “so it was withdrawn from the market” at the seller’s wish.
Advertisements for the sale of the site were taken down from property website OneRoof in December.
AdvertisementAdvertise with NZME.
Council has valued the 7.62ha site at $8.7m, but it is believed the owners had hoped to get more than $10m.
Owners Prema Charitable Trust bought the property in 2008 for just over $4m. The trust operates the Kawai Purapura retreat at the site, which was also home to the Wellpark College of Natural Therapies.
It had been advertised as “an incomparable opportunity” to secure a huge slice of city land where applying for rezoning could generate “considerable value uplift”.

The site sits on land overlooking Albany’s commercial precinct and is close to Albany Bus Station and Westfield shopping centre.
Centrepoint was opened by Potter in 1977 and at its peak had a permit for 244 fulltime residents.
It was based on therapeutic encounter groups popularised in California in the 1960s, promising social transformation by encouraging open communication.
The commune was shut down in 2000 after some leaders, including Potter, were convicted of sexual abuse and drugs crimes.
Potter was convicted and sentenced in 1990 to three and a half years in jail on drug charges and in 1992 to seven and a half years for indecent assaults on five children, some as young as 3.
Other men were also convicted of indecently assaulting minors, sexually assaulting minors and attempted rape of a minor.
A 2010 Massey University study revealed that one in every three children at Centrepoint was sexually abused.
AdvertisementAdvertise with NZME.
Three survivors from the infamous cult spoke out in 2021, writing an open letter calling for restorative justice for children who were abused.
Christchurch GP Caroline Ansley wrote the letter with two other Centrepoint survivors, who are featured in the TVNZ docudrama Heaven and Hell – The Centrepoint Story.

Ansley said realising she was not the only one who was abused was empowering.
“I had to ask myself what’s worse – fear of exposure or the disappointment of not advocating for the right thing.”
The trio asked in their letter that former Centrepoint members consider “their obligations towards the children of the community” and acknowledge the resulting social, emotional and psychological difficulties many still experience as adults.
“We ask you to hear our voices. We ask you to set aside your complex feelings surrounding this issue and acknowledge our realities. We ask that you work with us to find ways to enable healing and restoration of the history.”
AdvertisementAdvertise with NZME.
Drugs such as LSD and ecstasy were manufactured on the property and taken in group experiments that involved youngsters.
“This potent mix of social control, parental child neglect, drug use and hyper-sexuality set the scene for child abuse to occur,” the letter stated.
The signatories, some of them anonymous but known to the authors, include Louise Winn. She was only 11 when she was brought to Potter’s hut by his wife Margie. She was later also sexually abused by his son John Potter and other men.
To keep predators away at night, the girl barricaded herself with junk in her caravan on the property or escaped into the bush.