

Houses prices in Oxford have increased more than the average for the South East, the latest figures show.
The increase in house prices rose by 1.7 per cent in the city over February contributing to the longer-term trend, which has seen property prices in the area grow by 1.6 per cent over the last year.
The average Oxford house price in February was £460,277, 23.4 per cent more than the average price in the South East, Land Registry figures show.
Over the month, the picture was different to that across the South East, where prices increased 1.1 per cent, and Oxford was above the 0.4 per cent rise for the UK as a whole.
Over the last year, the average sale price of property in Oxford rose by £7,400, putting the area sixth among the South East’s 64 local authorities with price data for annual growth.
The highest annual growth in the region was in Winchester, where property prices increased on average by 6.1 per cent, to £490,000.
At the other end of the scale, properties in Gosport lost 12.2 per cent of their value, giving an average price of £234,000.
First-time buyers in Oxford spent an average of £405,600 on their property, £5,300 more than a year ago, and £40,000 more than in February 2019.
By comparison, former owner-occupiers paid £511,000 on average in February, 26 per cent more than first-time buyers.
Owners of terraced houses saw the biggest rise in property prices in Oxford in February as they increased by 1.9 per cent, to £456,005 on average.
Over the last year, prices rose by 1.6 per cent.
A 5.5 per cent drop in property prices saw London’s housing market rank 95th out of 107 major cities around the world.
Knight Frank’s Global Residential Cities Index for Q4 2023 reported that London was one of only 18 urban centres registering declining annual house prices at the end of last year.
“Like all markets, London has been challenged by sharply higher interest rates,” Liam Bailey, Global Head of Research at Knight Frank, told Homes & Property.“However London’s weaker than average performance has been affected by higher price to income multiples and challenging affordability metrics compared to many other world cities.”
Other cities notorious for the high cost of housing saw an uptick in property prices. New York, which ranked 17th, saw house prices rise 7.8 per cent year-on-year, while Vancouver (30th) registered a rise of 4.8 per cent. Hong Kong, however, saw a 7.2 per cent drop that put it in 103rd place.
Knight Frank said that low housing stock boosted property prices across America, with house prices up more than seven per cent in Philadelphia, Los Angeles, Chicago, Miami, and Boston.The weaker markets were predominantly European.
Munich came in at 96th with a 6.6 per cent drop in house prices, Paris ranked at 99th (6.9 per cent), while Luxembourg City came dead last with a 13.6 per cent drop.
Warsaw bucked the trend, with 23.5 per cent annual growth bagging it 3rd place in the rankings.
The top two spots went to cities in Turkey, where rampant inflation has pushed up prices. House prices in Ankara almost doubled, rising an eyewatering 92.2 per cent in 12 months.
In general, Knight Frank reported, most cities saw signs of recovery after a year of falling house prices.
“Global city housing markets have seen a noteworthy resurgence, with an average price increase of 3 per cent in the 12-months to Q4 2023, a notable uptick from the 1.6 per cent in the previous quarter.
“The anticipation of lower interest rates later this year, is reflected by 67 per cent of markets seeing positive price growth in the past year.
London’s market will recover eventually too, they said. “Our view is that price growth will turn positive this year as demand outpaces relatively weak supply of properties for sale,” explained Bailey.
Nationwide has already reported that London house prices were up 1.2 per cent in March, with Savills reporting a 35 per cent uptick in transactions for the start of 2024.
Chestertons said there has only been a two per cent uplift in the number of homes coming to market in London between February and March.
“Although we are expecting more sellers to list their properties over the coming weeks, demand will still outweigh supply and buyers are facing competitive conditions with even less room for price negotiations”, said Head of Sales Matt Thompson.
The estate agents said it had seen an 11 per cent drop in the number of sellers prepared to compromise on asking prices.
House prices fell one per cent in March, according to the latest data, but strong quarter on quarter growth still suggests property valuations are set for a 2024 rebound.
According to the latest figures from Halifax, the average price of a home is £288,430, around £2,900 less than in February.
It follows five months of consecutive rises in property prices.
Nonetheless,two per cent quarter on quarter growth suggests there remains positivity in the sector.
The data mirrors a similar study earlier this week from Nationwide.
In London, the cost of a home grew by 0.4 per cent to £539,917, remaining the most expensive region in the UK to buy a home.
Kim Kinnard, director at Halifax mortgages said a monthly fall is “not entirely unexpected”.
“Particularly in view of the reset the market has been going through since interest rates began to rise sharply in 2022,” she said.
“Despite this house prices have shown surprising resilience in the face of significantly higher borrowing costs.”
She added: “Affordability constraints continue to be a challenge for prospective buyers, while existing homeowners on cheaper fixed-term deals are yet to feel the full effect of higher interest rates.”
“This means the housing market is still to fully adjust, with sellers likely to be pricing their properties accordingly.”
Today’s reading mirrors figures published by Nationwide earlier this week.
The lender said property remained up on an annual basis – by 1.6 per cent – but fell on a monthly basis by 0.2 per cent.
Rightmove reported last month that March saw the highest rise in house prices in 10 months with average price of newly marketed properties rose by £5,279 to £368,000.
It is thought that Brits will continue to hold off buying until interest rates come down from their historic highs.
The Bank of England held them at 5.25 per cent again, with most experts betting they will drop later in the summer.
Mortgage rates have also started rising again following signs that deals were cooling at the start of the year.
Sam Mitchell, chief of Purplebricks, said: “The blip in house prices was caused by a small increase in rates at the start of March, since then we have seen banks compete more aggressively, rates reduce further, inflation come down ahead of expectations, and both viewings and offers levels are ahead of expectations.
“Given the Bank of England’s future guidance is pointing to further cuts we expect prices gradually increase throughout the year until the inevitable uncertainty of the General Election bites probably in October. Sellers should act without delay if they want to take advantage of what should be a busy spring market.”

A new research by ANAROCK property consultants has shown that the residential real estate market in the Mumbai Metropolitan Region (MMR) has witnessed a surge in home buying activity in recent times.
This trend is seen despite the relentless rise in property prices in the region.
The MMR housing market holds the top position in both supply and demand, with new launches of about 1.57 lakh units in 2023 and sales at about 1.53 lakh units, both at all-time high levels.
Both housing supply and sales in MMR have been on an upward trajectory since 2020. New launches and housing sales in 2023 surged 27 percent and 40 percent annually when compared to 2022.
MMR witnessed a 15 per cent growth in average property prices, from approximately ₹11,890 per sq. ft. in 2022 to approximately ₹13,700 per sq. ft. in 2023.
The ANAROCK study shows, Mumbai emerged as MMR’s undisputed champion in 2023 with the highest year-on-year jump in housing sales compared to 2022. Mumbai’s peripheral western suburbs are seeing a protracted housing boom, with sales skyrocketing by a whopping 82 per cent compared to last year.
The factors fuelling MMR’s Housing Boom include a strong economic outlook, rapid infrastructure development, the fear of missing out and a wide range of options in a widely evolving market.
MMR is the financial and commercial powerhouse of India, attracting a vast talent pool seeking better career prospects and a higher standard of living.
This demographic contributes significantly to the real estate sector of MMR, driving demand for housing. The government’s push for infrastructure development in the MMR is another major driver. Improved connectivity through new highways, metro lines, and projects like the Navi Mumbai International Airport, Mumbai Coastal Road Project, and establishment of a new city ‘Third Mumbai’ are enhancing the overall quality of life.
This is incentivizing buyers to invest in micro-markets that will benefit from better infrastructure in the future. The consistent property price appreciation in MMR has instilled a fear of missing out (FOMO) among buyers.
This perception, is leading them to enter the market even at current high property prices.ANAROCK study shows that real estate in MMR has historically proven to be a high-yield investment. Investors see property as a hedge against inflation and a source of stable rental income.
The MMR market is constantly transforming, offering an increasingly wider range of property options. From smaller, affordable apartments to luxurious high-rises, there are options in for budgets and lifestyles. This caters to the diverse needs of today’s homebuyers and is driving the housing boom in MMR.
This is your last free article.
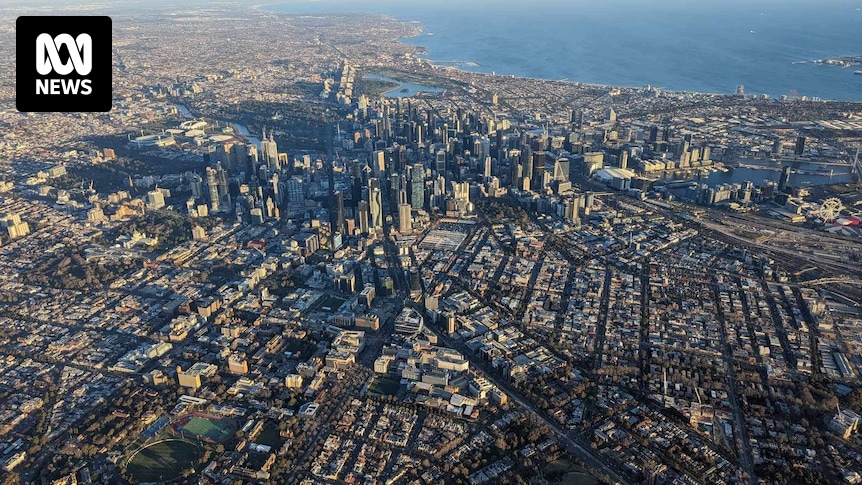
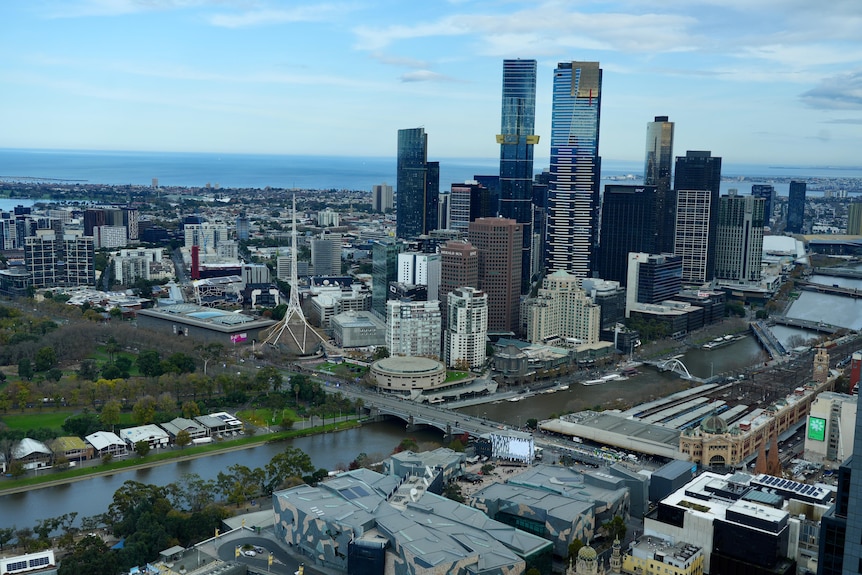
According to data, Melbourne is the only Australian capital city that has seen an improvement in affordability metrics over the past five years.
It might not seem that way when you look at the cost of some properties, but when you consider the lack of movement in the market and the steady growth of income, experts say Melbourne is tracking well.
“Five years ago, [Melbourne] would have been relatively expensive compared to the broader capital city market,” CoreLogic’s head of research Eliza Owen said.
“Now, it’s actually got a lower dwelling-value-to-income ratio.”
She said while Melbourne wasn’t what you would call an “affordable” or “accessible” housing market, it had seen subtle improvements in affordability over time, unlike other capital city markets.
“As we’ve come through the other side of rate rises, cost-of-living crisis, and households feeling the squeeze when it comes to trying to save for a deposit, Melbourne actually looks relatively affordable,” she said.
But how affordable is Melbourne really?
Can you afford a house in Melbourne?
According to the Australian Bureau of Statistics, in November 2023 the average weekly earning for an adult working full-time in Victoria was $1,858.10 before tax.
That equates to about $96,621 a year or roughly $74,752 after tax.
It is generally accepted that if a person spends 30 per cent or more of their income on their mortgage, they are likely to be experiencing “housing stress”.
For someone on the average Victorian wage, that’s about $22,426 or more annually.
Based on that, and by using an average interest rate of 6.18 per cent over a 30 year loan, the average single person would need to borrow less than $306,000 to avoid housing stress.
That doesn’t include the 20 per cent deposit required to avoid Lenders Mortgage Insurance.
Based on today’s inflation rates and assuming a buyer has that 20 per cent deposit, they could purchase a property up to $362,400.
Given that, and the data obtained by the ABC, a single income household of an average Victorian wage, could not comfortably afford to buy a house in any Greater Melbourne suburb.
We doubled the figures and applied the same formula to see if owning a home was more achievable for a double income household who both earn the average wage.
In this scenario, couples could purchase a house up to $733,800 — borrowing no more than $611,500 combined with a 20 per cent deposit of $122,300.
Of the hundreds of suburbs in Greater Melbourne, about 70 would be considered affordable for these households.
It is important to note we haven’t added the cost of stamp duty to these figures which can vary in Victoria from about 1.4 per cent to 6.5 per cent of the properties value.
Bruce Carr, principal of Loanscape and independent mortgage broker, said lower income earners were being squeezed out of the market.
“What I saw in the last quarter is borrowing capacity improved slightly, but the average loan size increased. So the income required to get that actually increased,” he said.
“In July 2021 a couple with annual family income of $120,000 could borrow up to $785,000. That same couple can now access a maximum $520,000.
“It’s only wealthier families that can afford to borrow the amounts required to get into the housing market.”
Where are the cheapest suburbs for a house?
The median price for a house in Greater Melbourne is currently $942,779, according to CoreLogic data.
That’s a 4.4 per cent increase on the previous year and a 30 per cent jump on prices seen in 2019.
The cheapest suburb to purchase a house is Melton, in Melbourne’s west, where the median house price is $473,074.
It’s closely followed by neighbouring Melton South.
Both of these suburbs have seen property prices fall over the last two years.
In general, Melbourne’s west remains the cheapest area to purchase a house with a median price of $699,117.
The area also includes suburbs like Brookfield, Deer Park, Hoppers Crossing, Kings Park and Wyndham Vale.
Melbourne’s north-west which includes suburbs like Coolaroo, Dallas and Campbellfield, is the next most affordable area with the median price for a house $756,176.
While slightly more expensive, Ms Owen said first-time buyers were turning to the north-east and the outer-east of Melbourne, including Belgrave and Ferntree Gully.
“This seems to be where young family buyers are able to access a detached house for much cheaper than the inner-east,” Ms Owen said.
What about the cheapest areas for an apartments and units?
Melbourne has seen a shift towards buyers looking to apartments over detached homes, which Ms Owen said could partially be put down to first homebuyers turning to the cheaper option.
“Unit sales have held up more strongly towards the start of the year with about 5,900 sales in the three months to February,” she said.
“That’s above the historic five-year average of about 5,880.”
Despite its close proximity to Melbourne’s CBD and access to transport and other services, Carlton is the cheapest suburb for an apartment, with a median value of $349,078.
While it may not necessarily be attracting families, Ms Owens said it was a good area for investors.
“We’re talking about cheap, small apartments that are relatively accessible for investors and the rent yields on them are pretty good,” she said.
“What’s interesting for [Carlton], it’s actually in positive growth territory now, the price is rising.”
She said the cheap inner-city unit market was one of the markets with more momentum.
Melton and Melton South are again within the top five cheapest suburbs if you’re in the market for an apartment, about $100,000 less than the median cost of a house in the same area.
Where are Melbourne’s most expensive suburbs?
Principal partner at SGC Economics and Planning, Marcus Spiller, said house prices were typically linked to accessibility to jobs and opportunity.
“If you live in an area that has really good access to heaps of jobs within minimum travel time, it’s very likely that your housing will be more costly,” he said.
It’s reflected in the data, with Deepdene, about 9 kilometres east of Melbourne’s CBD, topping the list for the most expensive suburb to buy a house.
The median value for a house there is $3.6 million.
It’s closely followed by Brighton, which is home to one of Melbourne’s most popular beaches. A house there could set you back about $3.4 million.
Portsea — another coastal community located down the Mornington Peninsula, also sits within the top five most-expensive suburbs, with the median house price sitting at $3.08 million.
Ms Owen said the Mornington Peninsula as a whole had seen the largest growth over the last five years, with prices rising 40 per cent.
“That comes back to things like the socio-economics of an area, how exclusive it is, often these areas are waterfront as well and that certainly has a premium in metropolitans,” she said.
The closer you get to Melbourne’s CBD, the more likely you are to pay more than $1 million for a house.
The suburb where you’ll find the most expensive apartment is Ashburton where the median price is $1.3 million.
Beaumaris is closely following its tail, a suburb that had one of the largest increases in prices over the past five years — 29.9 per cent.
The average Watford home now costs almost £400,000 as house prices rose more than the East of England average in January.
The 1.3 per cent rise from December last year did not reverse the longer-term trend however, which has seen property prices in the area suffer a 4.8 per cent annual decline.
It brought the average Watford house price to £392,913 in the first month of 2024, Land Registry figures show.
Over the month, the picture was similar to that across the East of England, where prices increased 1.2 per cent, and Watford was above the 0.5 per cent rise for the UK as a whole.
Over the last year, the average sale price of property in Watford fell by £20,000 – putting the area 32nd among the East of England’s 45 local authorities with price data for annual growth.
The highest annual growth in the region was in East Cambridgeshire, where property prices increased on average by 9.1 per cent, to £352,000. At the other end of the scale, properties in Ipswich lost 11.3 per cent of their value, giving an average price of £213,000.
First steps on the property ladder
First-time buyers in Watford spent an average of £348,000 on their property – £17,000 less than a year ago, but £43,000 more than in January 2019.
By comparison, former owner-occupiers paid £451,000 on average in January – 29.6 per cent more than first-time buyers.
Property types
Owners of flats saw the biggest rise in property prices in Watford in January – they increased 1.7 per cent, to £283,446 on average. Over the last year, prices dropped by 3.5 per cent.
Among other types of property:
-
Detached: up 1.3 per cent monthly; down 5.3 per cent annually; £930,118 average
-
Semi-detached: up 1.1 per cent monthly; down 4.8 per cent annually; £528,251 average
-
Terraced: up 1.1 per cent monthly; down 5.9 per cent annually; £416,587 average
How do property prices in Watford compare?
Buyers paid 16.8 per cent more than the average price in the East of England (£337,000) in January for a property in Watford. Across the East of England, property prices are higher than those across the UK, where the average cost is £282,000.
The most expensive properties in the East of England were in Three Rivers – £558,000 on average, and 1.4 times the price as in Watford. Three Rivers properties cost 2.7 times the price as homes in Great Yarmouth (£210,000 average), at the other end of the scale.
The highest property prices across the UK were in Kensington and Chelsea, at £1.2 million.
Factfile
Average property price in January:
Annual change to January:
Highest and lowest annual growth in the East of England:

House prices increased slightly, by 0.4%, in Cornwall in January, new figures show.
But the rise does not reverse the longer-term trend, which has seen property prices in the area suffer a 2.8% annual decline.
The average Cornwall house price in January was £300,974, Land Registry figures show – a 0.4% increase on December.
Over the month, the picture was different to that across the South West, where prices increased 1.5%, and Cornwall was lower than the 0.5% rise for the UK as a whole.
Over the last year, the average sale price of property in Cornwall fell by £8,800 – putting the area 20th among the South West’s 26 local authorities with price data for annual growth.
The highest annual growth in the region was in South Hams, where property prices increased on average by 11%, to £432,000.
At the other end of the scale, properties in Torridge lost 13% of their value, giving an average price of £286,000.
First steps on the property ladder
First-time buyers in Cornwall spent an average of £247,000 on their property – £7,200 less than a year ago, but £55,700 more than in January 2019.
By comparison, former owner-occupiers paid £339,100 on average in January – 37.3% more than first-time buyers.
Property types
Owners of semi-detached houses saw the biggest rise in property prices in Cornwall in January – they increased 0.6%, to £293,852 on average. Over the last year, prices dropped by 1.7%.
Among other types of property:
Detached: up 0.4% monthly; down 2.9% annually; £439,310 average
Terraced: up 0.4% monthly; down 3.1% annually; £240,318 average.
Flats: up 0.2% monthly; down 3.8% annually; £166,570 average
How do property prices in Cornwall compare?
Buyers paid 5% less than the average price in the South West (£317,000) in January for a property in Cornwall. Across the South West, property prices are higher than those across the UK, where the average cost is £282,000.
The most expensive properties in the South West were in Cotswold – £500,000 on average, and 1.7 times the price as in Cornwall. Cotswold properties cost 2.3 times the price as homes in Plymouth (£221,000 average), at the other end of the scale.
The highest property prices across the UK were in Kensington and Chelsea, at £1.2 million.
Factfile
Average property price in January Cornwall: £300,974
The South West: £316,879UK: £281,913
Annual change to January
Cornwall: -2.8%
The South West: -0.6%UK: -0.6%
House prices dropped slightly by 0.3 per cent in Oxford in January, new figures show.
The drop contributes to the longer-term trend, which has seen property prices in the area suffer a one per cent annual decline.
The average Oxford house price in January was £440,092, Land Registry figures show, a 0.3 per cent decrease on December.
Over the month, the picture was different to that across the south east, where prices increased 0.6 per cent, and Oxford was lower than the 0.5 per cent rise for the UK as a whole.
Over the last year, the average sale price of property in Oxford fell by £4,600, putting the area 12th among the south east’s 64 local authorities with price data for annual growth.
The highest annual growth in the region was in Winchester, where property prices increased on average by 7.3 per cent, to £505,000.
At the other end of the scale, properties in Gosport lost 14.1 per cent of their value, giving an average price of £229,000.
First-time buyers in Oxford spent an average of £387,600 on their property.
This is £5,400 less than a year ago, but £22,900 more than in January 2019.
By comparison, former owner-occupiers paid £488,800 on average in January, 26.1 per cent more than first-time buyers.
Owners of terraced houses saw the biggest fall in property prices in Oxford in January, they dropped 0.5 per cent in price, to £434,369 on average

American homeowners may have been unfairly tarred with the NIMBY brush, with new research showing that wind turbines have a far smaller effect on house prices across the country than previously feared.
Using data from 300 million home sales and their proximity to 60,000 wind turbines, researchers found an impact of just 1% in value for houses that have a view of turbines within 6 miles.
The study, published today in the Proceedings of the National Academy of Sciences (PNAS) shows that only houses within 1.2 miles of a turbine saw their value significantly affected, at up to 8%. Beyond 1.2 miles, the impact rapidly tailed off.
The researchers note that fewer than 250,000 buildings in the U.S. sit within 2.5 miles of a wind turbine, with 8.5 million homes and structures within 6 miles of one.
“Our research responds to some arguments of local opposition against wind turbines, the classic ‘not in my backyard’ problem that is a hot topic not only in the U.S. but also in Europe and Germany,” says Leonie Wenz, a co-author of the study from the Potsdam Institute for Climate Impact Research (PIK), who suggests the findings could also be used as a basis for compensating affected homeowners.
“Our study also underlines that these impacts have been small in the last two decades, and that we can expect them to become even less of an issue in the future,” she adds.
The U.S. is investing heavily in renewable energy generation, with the Department of Energy describing wind power as “one of the fastest growing and lowest-cost sources of electricity in America.” But even as the Inflation Reduction Act helps incentivize the development of clean energy generation across the country, negative perceptions about wind turbines have in some areas led to strong local opposition to wind projects, causing them to be abandoned.
Notably, the study is the first of its kind to take into account not just of the proximity of homes to turbines, but whether the turbines were within sight of those homes. That’s significant, as Wei Guo of the Italian Centro Euro-Mediterraneo sui Cambiamenti Climatici (CMCC), and a co-author of the study, explains.
“Unlike previous studies, we did not only consider proximity, but also the actual visibility of wind turbines,” Guo says. “We calculated whether you can see the turbine, or whether there is a mountain in the way, for example, and if so, how the house value changes compared to other houses in the same area where residents cannot see the wind turbine.”
That consideration reveals an important detail: any negative economic effect of a wind turbine was found to decrease rapidly as distance from the turbine increased. Furthermore, the researchers say, the effect diminished over time, with any reduction in value peaking at three years following the installation of the turbine, and subsequently falling away.
“What really surprised me is that the house value bounces back to the original price over the years,” says Maximilian Auffhammer, a professor of agricultural and resource economics at the University of California, Berkeley, and a study co-author, who also notes that for turbines installed after 2017, any negative effect was “indistinguishable from zero.” In sum, Auffhammer says, the findings show that “the impact of wind turbines on house prices is much smaller than generally feared.”