

The real estate market in India is experiencing rapid growth. Amid property transactions, individuals frequently encounter the term ‘circle rate’ in real estate. Understanding the distinction between circle rate and market value is crucial, especially for those considering property purchases.
Circle rate, often set by local authorities, represents the minimum price at which a property, whether commercial, residential, or land, can be registered for sale. It serves as a regulatory tool to control property prices. District administrations are tasked with establishing standard rates for properties across various states and cities, with circle rates differing by location. Transactions below the circle rate are typically not registered. In states like Haryana, Punjab and Uttar Pradesh, circle rates may also be known as collector rates or district collector rates.
Moreover, the circle rate influences property ownership transfers. It is determined based on the property’s location within the state and city, with adjustments reflecting changes in the area’s landscape and surrounding developments.
On the other hand, the market rate refers to the actual price at which a property is sold by the builder. This rate is influenced by factors such as the property’s size, amenities and location. Generally, the market rate significantly exceeds the circle rate. Builders rarely sell properties at circle rates as it would result in substantial losses. Consequently, properties are typically unavailable at circle rates. The market rate provides insight into the real estate value appreciation within a specific area.
While the circle rate serves as a regulatory benchmark for property transactions, the market rate reflects the actual selling price determined by various factors affecting the property’s value.
Understanding these terms is crucial for prospective buyers to navigate the real estate market effectively and make informed decisions regarding property investments.
top videos
Mahua Moitra Is Likely To Skip The Summons: ED Sources to CNN-News18 | Cash-For-query Case Probe
PM Modi Reaches Sambhal, Offers Prayers And Prepares To Lay Foundation Stone In Kalki Dham | News18
Ashok Chavan Camp Leaders Won’t Enter Any Alliance Party Of Mahayuti Before Lok Sabha Elections
Russian Opposition Leader Alexei Navalny’s Wife Pays Tribute To Him | Alexei Navalny Death | N18V
Prince William ‘Would Not Allow Harry To Return’ | Prince Harry News | English News | News18 | N18V
first published: February 19, 2024, 14:06 IST


House prices in Bromley have gone down by an average of over £4,000 in the month of November, according to figures from the Land Registry.
The latest data from the government department reveals that in November 2023 average house prices in Bromley reached £500,485.
This was down from £505,164 in October, representing a 0.9 per cent decrease. In the last 12 months it has fallen by -2.5 per cent.
If you are interested in buying or renting a home, you can see the latest properties in and around Bromley here.
Breaking it down for specific types of housing, some prices saw an increase despite the general fall.
-
Detached houses – Down to £1,033,315 from £1,051,473 in October
-
Semi-detached houses – Down to £625,980 from £633,878 in October
-
Terraced houses – Down to £459,524 from £465,538 in October
-
Flats – Up to £309,617 from £309,508 in October

What%are%the%latest%house%prices%in%Bromley%? (PA)
Despite the fall in prices this month, Bromley is still far above the UK average with a typical property value in the nations reaching £284,950 in November.
In cash terms, the average house price in November was £-6,142 lower than a year earlier with house price growth decelerating to -2.1 per cent in November 2023. Prices were down by -0.8 per cent month on month.
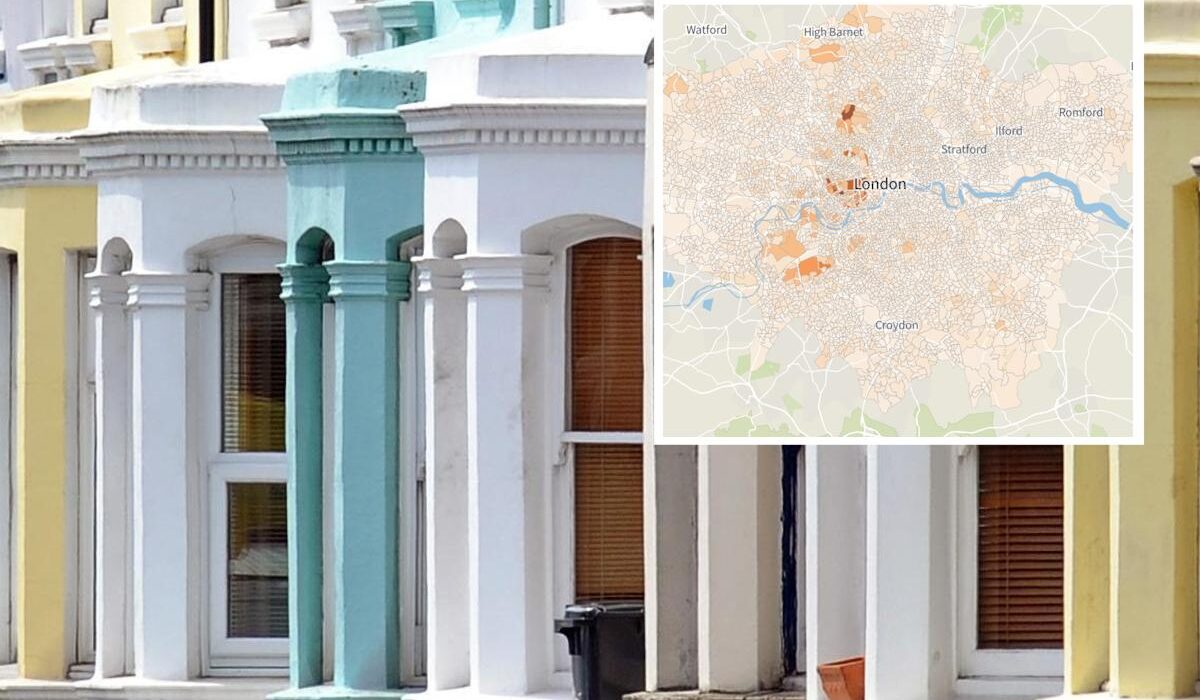
We have created this map for the London so you can see the average house price in each neighbourhood since 1995.
Sites like Zoopla can offer an estimate valuation of your house if you input your postcode into their website here.
The above map can demonstrate which areas of Bromley are the most expensive for average house prices.
House prices in Croydon have plummeted by an average of over £12,000 in the month of November, according to figures from the Land Registry.
The latest data from the government department reveals that in November 2023 average house prices in Croydon reached £395,865.
This was down from £408,220 in October, representing a 3.0 per cent decrease. In the last 12 months it has fallen by -7.9 per cent.
If you are interested in buying or renting a home, you can see the latest properties in and around Croydon here.
Breaking it down for specific types of housing, all prices saw a decrease.
-
Detached houses – Down to £855,088 from £886,290 in October
-
Semi-detached houses – Down to £550,395 from £569,942 in October
-
Terraced houses – Down to £398,108 from £412,750 in October
-
Flats – Down to £270,631 from £276,702 in October
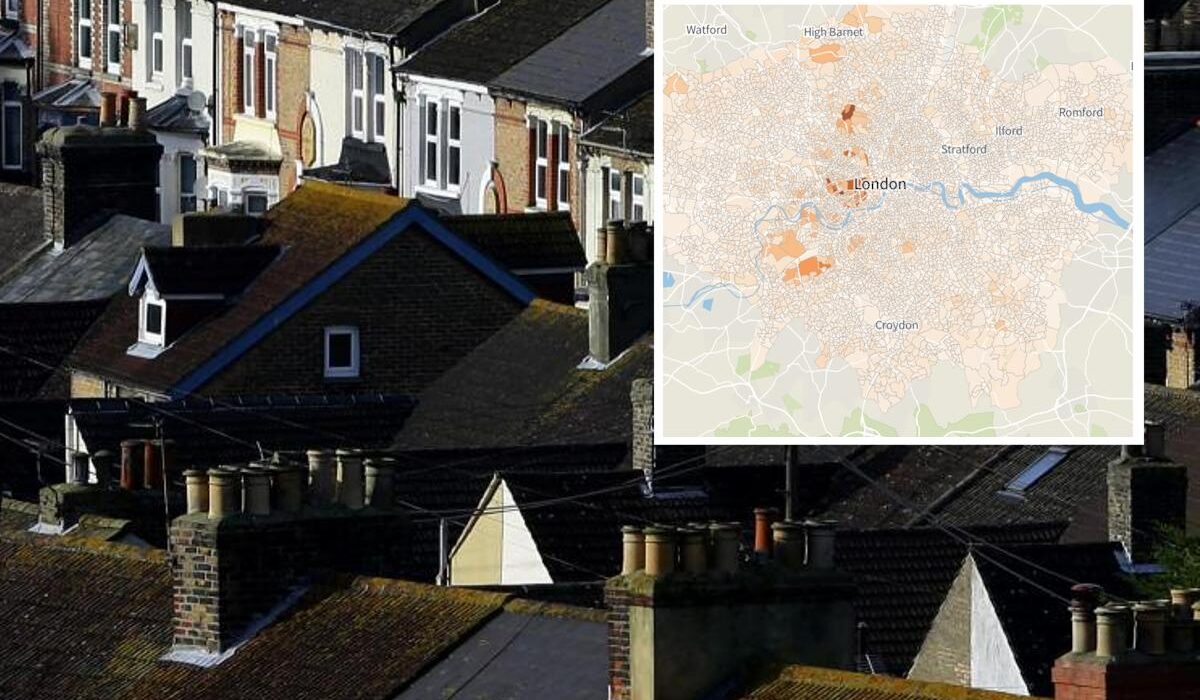
What%are%the%latest%house%prices%in%Croydon%? (PA)
Despite the fall in prices this month, Croydon is still well above the UK average with a typical property value in the nations reaching £284,950 in November.
In cash terms, the average house price in November was £-6,142 lower than a year earlier with house price growth decelerating to -2.1 per cent in November 2023. Prices were down by -0.8 per cent month on month.
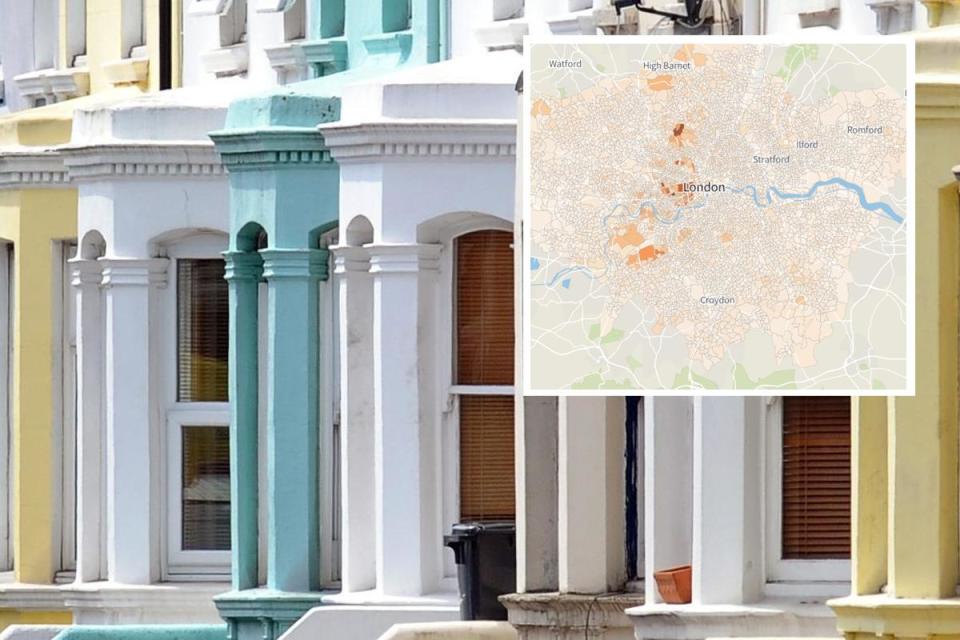
We have created this map for the London so you can see the average house price in each neighbourhood since 1995.
Sites like Zoopla can offer an estimate valuation of your house if you input your postcode into their website here.
The above map can demonstrate which areas of Croydon are the most expensive for average house prices.
House prices in Dartford have plummeted by an average of over £8,000 in the month of November, according to figures from the Land Registry.
The latest data from the government department reveals that in November 2023 average house prices in Dartford reached £358,525.
This was down from £367,044 in October, representing a 2.3 per cent decrease. In the last 12 months it has fallen by -1.6 per cent.
If you are interested in buying or renting a home, you can see the latest properties in and around Dartford here.
Breaking it down for specific types of housing, all prices saw a decrease.
-
Detached houses – Down to £730,137 from £747,143 in October
-
Semi-detached houses – Down to £457,228 from £468,688 in October
-
Terraced houses – Down to £352,121 from £362,175 in October
-
Flats – Down to £230,654 from £234,400 in October
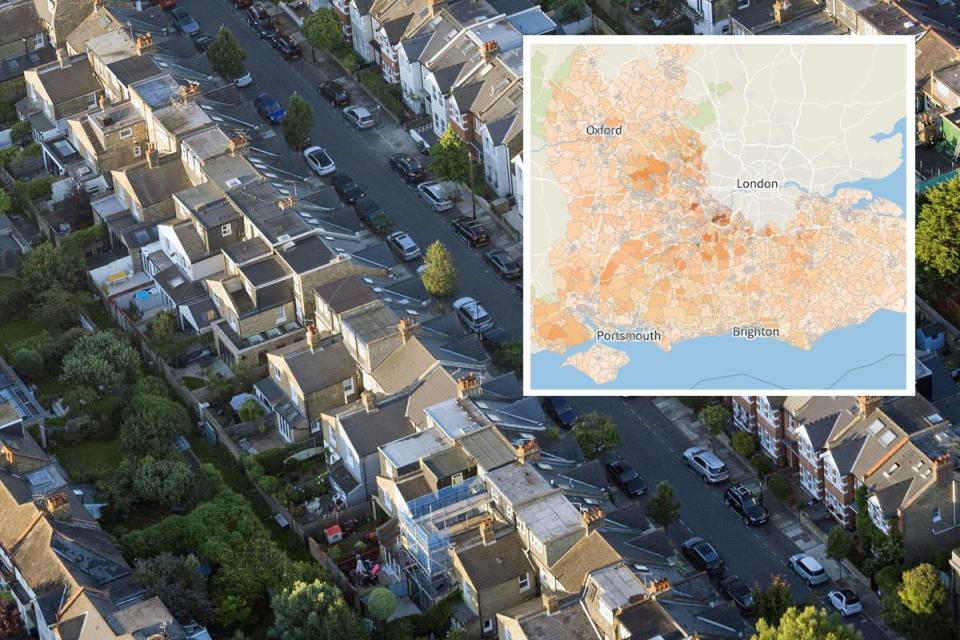
What%are%the%latest%house%prices%in�rtford%? (PA)
Despite the fall in prices this month, Dartford is still above the UK average with a typical property value in the nations reaching £284,950 in November.
In cash terms, the average house price in November was £-6,142 lower than a year earlier with house price growth decelerating to -2.1 per cent in November 2023. Prices were down by -0.8 per cent month on month.
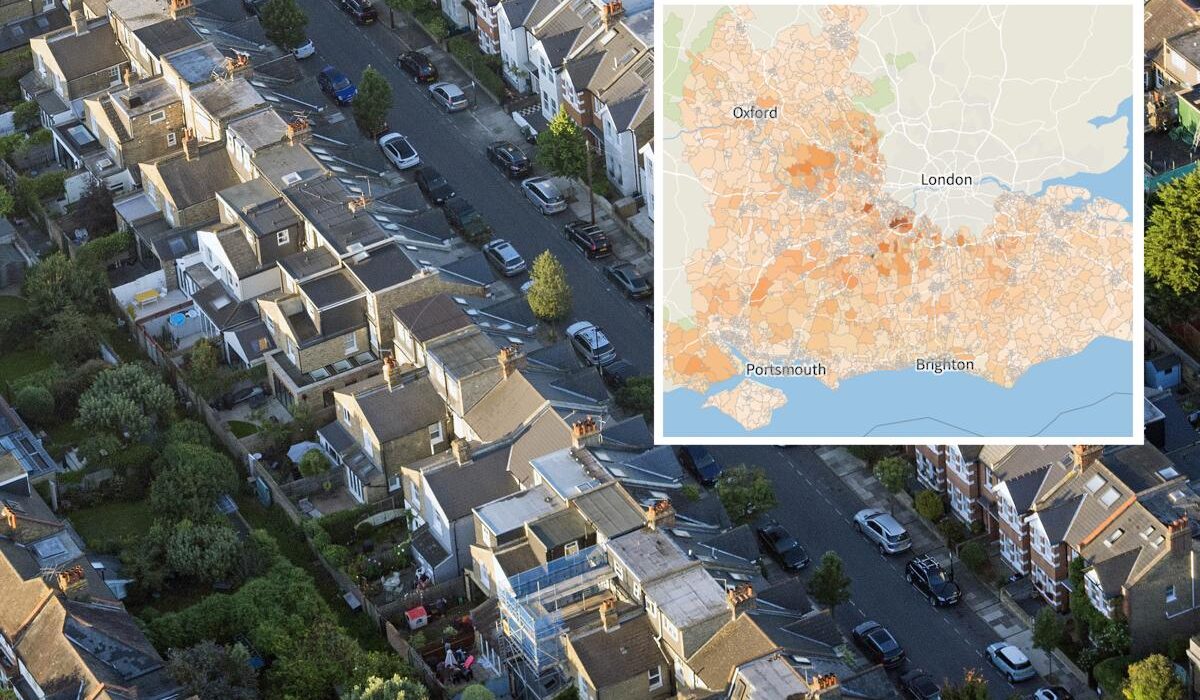
We have created this map for the South East so you can see the average house price in each neighbourhood since 1995.
Sites like Zoopla can offer an estimate valuation of your house if you input your postcode into their website here.
The above map can demonstrate which areas of Dartford are the most expensive for average house prices.
House prices in Merton have gone down by an average of over £700 in the month of November, according to figures from the Land Registry.
The latest data from the government department reveals that in November 2023 average house prices in Merton reached £569,635.
This was down from £570,383 in October, representing a 0.1 per cent decrease. In the last 12 months it has fallen by -1.5 per cent.
If you are interested in buying or renting a home, you can see the latest properties in and around Merton here.
Breaking it down for specific types of housing, some prices saw an increase despite the general fall.
-
Detached houses – Down to £1,658,955 from £1,717,592 in October
-
Semi-detached houses – Down to £905,220 from £912,437 in October
-
Terraced houses – Down to £628,451 from £630,796 in October
-
Flats – Up to £400,089 from £397,058 in October
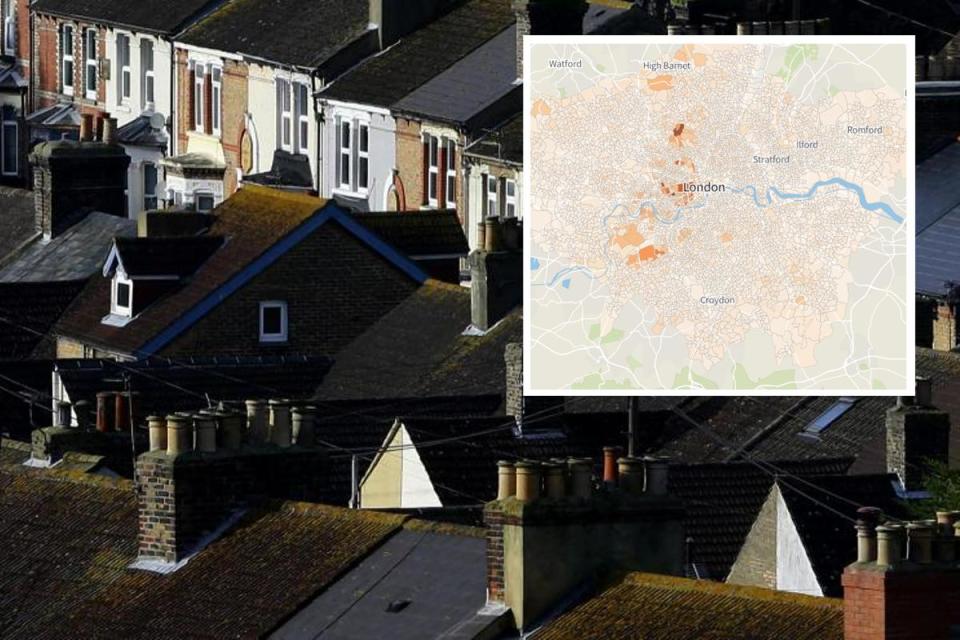
What%are%the%latest%house%prices%in%Merton%? (PA)
Despite the fall in prices this month, Merton is still far above the UK average with a typical property value in the nations reaching £284,950 in November.
In cash terms, the average house price in November was £-6,142 lower than a year earlier with house price growth decelerating to -2.1 per cent in November 2023. Prices were down by -0.8 per cent month on month.
We have created this map for the London so you can see the average house price in each neighbourhood since 1995.
Sites like Zoopla can offer an estimate valuation of your house if you input your postcode into their website here.
The above map can demonstrate which areas of Merton are the most expensive for average house prices.
House prices in Greenwich have plummeted by an average of over £10,000 in the month of November, according to figures from the Land Registry.
The latest data from the government department reveals that in November 2023 average house prices in Greenwich reached £414,055.
This was down from £424,932 in October, representing a 2.6 per cent decrease. In the last 12 months it has fallen by -6.1 per cent.
If you are interested in buying or renting a home, you can see the latest properties in and around Greenwich here.
Breaking it down for specific types of housing, all prices saw a decrease.
-
Detached houses – Down to £890,533 from £921,491 in October
-
Semi-detached houses – Down to £630,660 from £653,191 in October
-
Terraced houses – Down to £471,168 from £487,833 in October
-
Flats – Down to £346,176 from £351,962 in October
What%are%the%latest%house%prices%in%Greenwich%? (PA)
Despite the fall in prices this month, Greenwich is still well above the UK average with a typical property value in the nations reaching £284,950 in November.
In cash terms, the average house price in November was £-6,142 lower than a year earlier with house price growth decelerating to -2.1 per cent in November 2023. Prices were down by -0.8 per cent month on month.
We have created this map for the London so you can see the average house price in each neighbourhood since 1995.
Sites like Zoopla can offer an estimate valuation of your house if you input your postcode into their website here.
The above map can demonstrate which areas of Greenwich are the most expensive for average house prices.