


EXPANDS FOOTPRINT INTO NASHVILLE, TENNESSEE
ENTERS EIGHTH NEW U.S. STATE OF WEST VIRGINIA
ANNOUNCES US$60 MILLION PUBLIC EQUITY OFFERING
Not for distribution to U.S. newswire services or dissemination in the United States.
TORONTO, April 17, 2024 (GLOBE NEWSWIRE) — Flagship Communities Real Estate Investment Trust (“Flagship” or the “REIT”) (TSX: MHC.U; MHC.UN) today announced that it has entered into agreements to acquire (the “Acquisitions”) a total of seven manufactured housing communities (“MHCs”), comprising 1,253 lots, for an aggregate purchase price of approximately US$93.0 million (the “Purchase Price”). The Acquisitions are expected to close on or about May 15, 2024, subject to customary closing conditions.
The Purchase Price, along with approximately US$10 million of upfront capital expenditures, will be funded with the net proceeds from the REIT’s US$60 million offering of trust units (“Units”) (see “Equity Financing” below) and the remainder funded with new debt financing. The Purchase Price represents an attractive capitalization rate of 5.6% on Year 1 forecasted net operating income (“NOI”), and is expected to be accretive to the REIT’s adjusted funds from operations per Unit (diluted) (“AFFO”, see “Non-IFRS Financial Measures” below) on a leverage neutral and stabilized basis.
“These acquisitions are the largest in the REIT’s history to date and represent a milestone for our business as we continue to execute on our stated growth strategy,” said Kurt Keeney, President and CEO. “This is a generational opportunity to strategically expand our footprint into the adjacent Nashville market, as well as establish a presence in West Virginia, both markets that enable us to maximize existing synergies and leverage economies of scale.”
Transaction Highlights
-
Increased Size and Scale: Enhances Flagship’s scale, with the REIT’s pro forma portfolio consisting of 82 communities comprising 15,033 lots
-
Expansion into New Markets: The Acquisitions strengthen the REIT’s presence in Tennessee while entering the core Nashville market, which is one of the fastest growing markets in the U.S. The Acquisitions also expand the REIT’s operations into West Virginia, which represents the REIT’s eighth contiguous U.S. state, and provide significant growth opportunities to become a market leading owner in these markets
-
Organic Growth Potential: Organic cash flow growth generated by the REIT’s active lot leasing and home sales strategy, along with the implementation of expense optimization initiatives, are expected to generate stable, recurring and above market organic growth
-
Attractive Cost Basis: The Purchase Price represents a 5.6% capitalization rate based on year 1 NOI and a price per lot of approximately US$74,000
-
Operating Platform Synergies & Economies of Scale: The REIT continues to expand its portfolio without material incremental corporate level expenses and is well-positioned to further benefit from its scalable platform going forward. The REIT intends to continue its growth by sourcing acquisitions in existing and adjacent markets which are expected to generate economies of scale and operational synergies
-
Accretion & Leverage Profile: The completion of the Acquisitions is expected to be accretive on a stabilized and leverage neutral basis to the REIT’s long-term leverage target. Additionally, following the completion of the Acquisitions and the Offering, the REIT’s Debt to Gross Book Value Ratio (see “Other Real Estate Industry Metrics” below) is expected to be 39.4% (prior to any exercise of the over-allotment option) compared to 49.6% following completion of the IPO.
“We are excited to have sourced more off-market acquisitions through our long-standing industry relationships, providing the ability to establish a presence in Nashville, as well as West Virginia,” said Nathan Smith, Chief Investment Officer. “The Acquisitions are comprised of high-quality properties that adhere to our acquisition criteria and also provide the opportunity to expand our presence into Nashville, one of the fastest growing cities in the U.S., strategically located along the I-40 and I-65 Interstate corridors, within easy driving distance to employment opportunities, hospitals, schools, shopping and recreational facilities.”
Overview of Acquisitions
Nashville MSA
The Madison, Tennessee acquisition comprises 300 lots across approximately 38 acres and is located 13 miles north of downtown Nashville. It is within close proximity to malls, sports and medical facilities, golf courses, schools and entertainment, and is situated along the Cumberland River. The community is 67% occupied, including 6 rental homes. Community amenities include a playground, basketball court, clubhouse, and a community center. Nearby employers include Epic Systems, American Family Insurance, American Girl, Sub-Zero, Trek Bicycle, Lands’ End, Shopbop, Colony Brands and John Deere. The community sits near the interchange of Interstate 40 and 65 and is approximately a 20-minute drive to downtown Nashville.
The Murfreesboro, Tennessee acquisition comprises 173 lots across approximately 26 acres and is located 35 miles south of downtown Nashville. It is within close proximity to local supermarkets, restaurants, the municipal airport, universities and athletic centers. The community is approximately 99% occupied. Community amenities include a basketball court, clubhouse and greenery surrounded gazebo. Major employers in the community include Nissan Automotive, National Healthcare Corporation, State Farm Insurance, Amazon and St. Thomas Rutherford Hospital. The community sits near the interchange of Interstate 24 and is approximately a 30-minute drive to downtown Nashville.
Morgantown, West Virginia (2 Communities)
The Morgantown, West Virginia acquisitions comprise 2 communities. The first community comprises 187 lots across approximately 33 acres and is 88% occupied including 4 rental homes. The second community comprises 203 lots across approximately 41 acres and is 81% occupied including 102 rental homes. Both communities are centrally located in Morgantown along the Monongahela River, near Morgantown Municipal Airport, as well as nearby attractions including several golf courses, West Virginia University campus and Art Museum, Hazel Ruby McQuain Riverfront Park, Mountaineer Field, and West Virginia Coliseum. The communities are located adjacent to Interstates 79 and 68, providing excellent access to major transportation routes. Major employers include West Virginia University, Target, WVU Medicine, Mylan INC, IBM, Viatris, US Army, AT&T and Wipro.
Milton, West Virginia (Huntington MSA)
The Milton, West Virginia acquisition comprises 213 lots across approximately 33 acres. It is located 15 miles east of Huntington, West Virginia, within a quiet, well-maintained neighborhood near schools, shopping centers, hospitals, entertainment and more. The community is 66% occupied, including 21 rental homes. This community offers residents many amenities including a new playground, a clubhouse equipped with a full kitchen and billiards. The community is located adjacent to Interstate 64, providing excellent access to major transportation routes. Nearby employers include Mountain Health Network, Marshall University, Cabell County Board of Education, University Physicians & Surgeons, Walmart, Huntington Alloys Corp., Alcon Research LLC and Steel of West Virginia Inc.
Beckley, West Virginia (2 Communities)
The Beckley, West Virginia acquisitions comprise 2 communities. The first community comprises 120 lots across approximately 15 acres and is 87% occupied including 12 rental homes. The second community comprises 57 lots across approximately 14 acres and is 68% occupied including 7 rental homes. Both communities are well-maintained offering residents well-lit, paved streets and are centrally located, with easy access to schools, hospitals, post offices, doctors’ offices, shopping malls, movie theaters, restaurants and outdoor activities. The communities are located adjacent to Interstates 64 and 77, providing excellent access to major transportation routes. Nearby employers include Filter Companies, Lowe’s Home Improvement, McDonald’s, US Army, Enterprise, IBEX Global, AT&T and UPS.
Pro Forma Portfolio
The Acquisitions are a targeted and strategic expansion of the REIT’s portfolio, increasing the number of Flagship’s MHCs to 82 from 75 and the number of manufactured housing lots to 15,033 from 13,780. The table below provides a summary of the pending Acquisitions as of April 17, 2024.
|
|
|
Acquisitions Portfolio |
|
# of Communities |
(#) |
7 |
|
# of Lots |
(#) |
1,253 |
|
Average Lot Occupancy |
(%) |
78 |
Equity Financing
The REIT also announced today that it has entered into an agreement with a syndicate of underwriters co-led by BMO Capital Markets and Canaccord Genuity Corp. (together, the “Lead Underwriters”) to sell, on a bought deal basis, 3,910,000 Units at a price of US$15.35 per Unit for gross proceeds of approximately US$60 million (the “Offering”). The REIT has also granted the underwriters an over-allotment option to purchase up to an additional 15% of the Offering on the same terms and conditions, exercisable at any time, in whole or in part, up to 30 days after the closing of the Offering. The Offering is expected to close on or about April 24, 2024 and is subject to customary conditions, including the approval of the Toronto Stock Exchange. The Offering is not conditional upon closing of either of the Acquisitions.
The REIT intends to use the net proceeds from the Offering to fund (i) the Purchase Price (ii) capital expenditures, which are expected to be approximately US$10 million, in connection with the Acquisitions and (iii) for general business purposes. In the event the REIT is unable to consummate one or both of the Acquisitions and the Offering is completed, the REIT intends to use the net proceeds of the Offering to fund future acquisitions and for general business purposes.
The Offering is being made pursuant to the REIT’s base shelf prospectus dated June 7, 2023. The terms of the Offering will be described in a prospectus supplement to be filed with Canadian securities regulators.
The Units have not been, nor will they be, registered under the United States Securities Act of 1933, as amended, (the “1933 Act”) and may not be offered, sold or delivered, directly or indirectly, in the United States, except pursuant to an exemption from the registration requirements of the 1933 Act. This press release does not constitute an offer to sell or a solicitation of an offer to buy any Units in the United States.
Forward-Looking Statements
This press release contains statements that include forward-looking information (within the meaning of applicable Canadian securities laws). Forward-looking statements are identified by words such as “believe”, “anticipate”, “project”, “expect”, “intend”, “plan”, “will”, “may”, “can”, “could”, “would”, “must”, “estimate”, “target”, “objective”, and other similar expressions, or negative versions thereof, and include statements herein concerning: the terms of, timing for completion of and source of funding for the Acquisitions, the expected synergies from the Acquisitions, the expected impact of the Acquisitions and the Offering on the REIT’s Debt-to-Gross Book Value Ratio, the expected impact of the Acquisitions on the REIT’s AFFO per Unit (diluted), the expected impact of the Acquisitions on the REIT’s long-term leverage target, the REIT’s pro forma portfolio, the REIT’s growth opportunities (including organic growth potential), the scalability of the REIT’s platform, the REIT’s acquisitions strategy and expectations regarding economies of scale and operational synergies, the terms of and timing for completion of the Offering and the intended use of the net proceeds of the Offering.
These statements are based on the REIT’s expectations, estimates, forecasts, and projections, as well as assumptions that are inherently subject to significant business, economic and competitive uncertainties and contingencies that could cause actual results to differ materially from those that are disclosed in such forward-looking statements. While considered reasonable by management of the REIT as at the date of this news release, any of these expectations, estimates, forecasts, projections, or assumptions could prove to be inaccurate, and as a result, the forward-looking statements based on those expectations, estimates, forecasts, projections, or assumptions could be incorrect. Material factors and assumptions used by management of the REIT to develop the forward-looking information in this news release include, but are not limited to, that the conditions to closing of the Acquisitions will be met or waived in a timely manner and that both of the Acquisitions will be completed on the current agreed upon terms. When relying on forward-looking statements to make decisions, the REIT cautions readers not to place undue reliance on these statements, as they are not guarantees of future performance and involve risks and uncertainties that are difficult to control or predict. A number of factors could cause actual results to differ materially from the results discussed in the forward-looking statements, such as the risks identified in the REIT’s management’s discussion and analysis for the year ended December 31, 2023 available on the REIT’s profile on SEDAR+ at www.sedarplus.com, including, but not limited to, the factors discussed under the heading “Risks and Uncertainties” therein and the risk of the REIT’s plans with respect to debt bridge financing for the Acquisitions not being achieved as anticipated. There can be no assurance that forward-looking statements will prove to be accurate as actual outcomes and results may differ materially from those expressed in these forward-looking statements. Readers, therefore, should not place undue reliance on any such forward-looking statements. Forward-looking statements are made as of the date of this press release and, except as expressly required by applicable Canadian securities laws, the REIT assumes no obligation to publicly update or revise any forward-looking statement, whether as a result of new information, future events or otherwise.
Non-IFRS Financial Measures
In this press release, the REIT uses certain financial measures that are not defined under International Financial Reporting Standards (“IFRS”) including certain non-IFRS ratios. These measures are commonly used by entities in the real estate industry as useful metrics for measuring performance. However, they do not have any standardized meaning prescribed by IFRS and are not necessarily comparable to similar measures presented by other publicly traded entities. These measures should be considered as supplemental in nature and not as a substitute for related financial information prepared in accordance with IFRS. The REIT believes these non-IFRS financial measures and ratios provide useful supplemental information to both management and investors in measuring the operating performance, financial performance and financial condition of the REIT.
Adjusted Funds from Operations
Adjusted funds from operations (“AFFO”) is calculated in accordance with the definition provided by the Real Property Association of Canada (“REALPAC”). AFFO is defined as Funds From Operations (being IFRS consolidated net income (loss) adjusted for items such as distributions on redeemable or exchangeable units (including distributions on class B units of the REIT’s subsidiary, Flagship Operating, LLC (“Class B Units”)), unrealized fair value adjustments to Class B Units, unrealized fair value adjustments to investment properties, unrealized fair value adjustments to unit based compensation, loss on extinguishment of acquired mortgages payable, gain on disposition of investment properties, and depreciation) adjusted for items such as maintenance capital expenditures, and certain non-cash items such as amortization of intangible assets, and premiums and discounts on debt and investments. AFFO should not be construed as an alternative to consolidated net income (loss) or consolidated cash flows provided by (used in) operating activities determined in accordance with IFRS. The REIT’s method of calculating AFFO is substantially in accordance with REALPAC’s recommendations. The REIT uses a capital expenditure reserve of $60 per lot per year and $1,000 per rental home per year in the AFFO calculation. This reserve is based on management’s best estimate of the cost that the REIT may incur, related to maintaining the investment properties. This may differ from other issuers ’methods and, accordingly, may not be comparable to AFFO reported by other issuers. The REIT uses AFFO in assessing its distribution paying capacity.
“AFFO per Unit (diluted)” is defined as AFFO for the applicable period divided by the diluted weighted average Unit count (including Class B Units, vested restricted units and vested deferred trust units) during the period.
Please refer to the REIT’s management’s discussion and analysis for the year ended December 31, 2023 at “Non-IFRS Financial Measures – Funds from Operations and Adjusted Funds from Operations” for further detail on this non-IFRS financial measure and at “Reconciliation of FFO, FFO per Unit, AFFO and AFFO per Unit” for a reconciliation of historical AFFO to consolidated net income (loss), which disclosures are incorporated by reference into this press release.
Other Real Estate Industry Metrics
Debt to Gross Book Value Ratio
Debt to Gross Book Value Ratio is calculated by dividing indebtedness, which consists of the total principal amounts outstanding under mortgages payable and credit facilities, by Gross Book Value (being, at any time, the greater of: (a) the value of the assets of the REIT and its consolidated subsidiaries, as shown on its then most recent consolidated statement of financial position prepared in accordance with IFRS, less the amount of any receivable reflecting interest rate subsidies on any debt assumed by the REIT; and (b) the historical cost of the investment properties, plus (i) the carrying value of cash and cash equivalents, (ii) the carrying value of mortgages receivable, and (iii) the historical cost of other assets and investments used in operations).
About Flagship Communities Real Estate Investment Trust
Flagship Communities Real Estate Investment Trust is a leading operator of affordable residential Manufactured Housing Communities primarily serving working families seeking affordable home ownership. The REIT owns and operates exceptional residential living experiences and investment opportunities in family-oriented communities in Kentucky, Indiana, Ohio, Tennessee, Arkansas, Missouri, and Illinois. To learn more about Flagship, visit www.flagshipcommunities.com.
For further information, please contact:
Eddie Carlisle, Chief Financial Officer
Flagship Communities Real Estate Investment Trust
Tel: +1 (859) 568-3390


WINNIPEG, MB, April 11, 2024 /CNW/ – Artis Real Estate Investment Trust (“Artis” or the “REIT”) (TSX: AX.UN) is aware of media reports that it has entered into a conditional agreement to sell Park 8Ninety, an industrial property located in the Greater Houston Area, Texas.

The REIT can confirm that it has entered into a conditional agreement to sell Park 8Ninety for US$234.2 million, a premium to IFRS fair value at December 31, 2023, and representing a price per square foot of US$128. The transaction is subject to routine closing conditions and is expected to close in the second quarter of 2024.
“If completed, the sale of Park 8Ninety would be another important step towards achieving our objective of strengthening our balance sheet, reducing debt and enhancing liquidity,” said Samir Manji, President and Chief Executive Officer of Artis.
Park 8Ninety was developed in five phases between 2017 and 2022 and comprises 12 buildings that total 1,823,410 square feet of leasable area.
The REIT will provide any additional updates as appropriate.
Artis is a diversified Canadian real estate investment trust with a portfolio of industrial, office and retail properties in Canada and the United States. Artis’s vision is to become a best-in-class real estate asset management and investment platform focused on value investing.
Cautionary Statements
This press release contains forward-looking statements. For this purpose, any statements contained herein that are not statements of historical fact may be deemed to be forward-looking statements. Without limiting the foregoing, the words “expects”, “anticipates”, “intends”, “estimates”, “projects”, “seeks”, and similar expressions or variations of such words and phrases or state that certain actions, events or results ”may”, ”would” or ”will” occur or be achieved are intended to identify forward-looking statements. Particularly, statements regarding building Artis into a best-in-class asset management and investment platform focused on value investing in real estate, the REIT’s ability to strengthen its balance sheet, enhance its liquidity and meet its forthcoming debt obligations and use of proceeds of the transaction are forward-looking statements. Forward-looking statements are based on a number of factors and assumptions which have been used to develop such statements, but which may prove to be incorrect. Artis cannot assure investors that actual results will be consistent with any forward-looking statements and Artis assumes no obligation to update or revise such forward-looking statements to reflect actual events or new circumstances. All forward-looking statements contained in this press release are qualified by this cautionary statement.
SOURCE Artis Real Estate Investment Trust

View original content to download multimedia: http://www.newswire.ca/en/releases/archive/April2024/11/c7574.html

The main aim of stock picking is to find the market-beating stocks. But even the best stock picker will only win with some selections. At this point some shareholders may be questioning their investment in Cromwell European Real Estate Investment Trust (SGX:CWBU), since the last five years saw the share price fall 46%.
With that in mind, it’s worth seeing if the company’s underlying fundamentals have been the driver of long term performance, or if there are some discrepancies.
Check out our latest analysis for Cromwell European Real Estate Investment Trust
While the efficient markets hypothesis continues to be taught by some, it has been proven that markets are over-reactive dynamic systems, and investors are not always rational. By comparing earnings per share (EPS) and share price changes over time, we can get a feel for how investor attitudes to a company have morphed over time.
During the five years over which the share price declined, Cromwell European Real Estate Investment Trust’s earnings per share (EPS) dropped by 4.1% each year. Readers should note that the share price has fallen faster than the EPS, at a rate of 12% per year, over the period. This implies that the market is more cautious about the business these days. The low P/E ratio of 4.61 further reflects this reticence.
The company’s earnings per share (over time) is depicted in the image below (click to see the exact numbers).
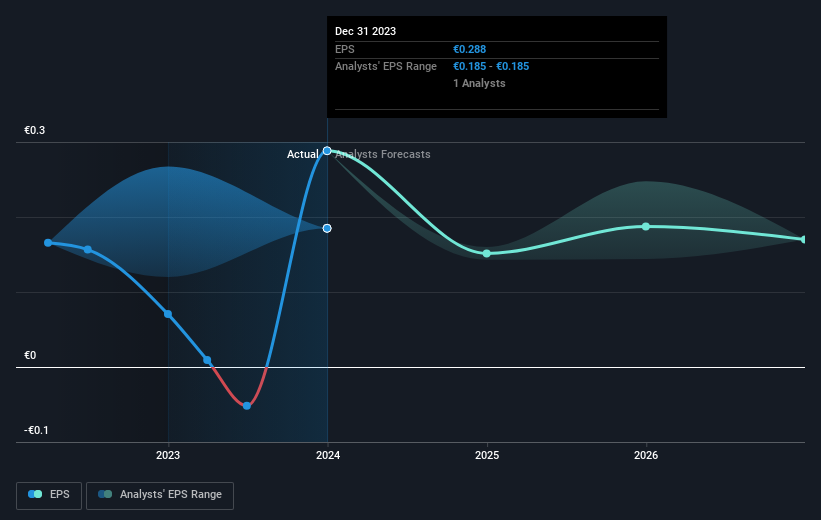
We know that Cromwell European Real Estate Investment Trust has improved its bottom line lately, but is it going to grow revenue? You could check out this free report showing analyst revenue forecasts.
What About Dividends?
It is important to consider the total shareholder return, as well as the share price return, for any given stock. The TSR is a return calculation that accounts for the value of cash dividends (assuming that any dividend received was reinvested) and the calculated value of any discounted capital raisings and spin-offs. So for companies that pay a generous dividend, the TSR is often a lot higher than the share price return. We note that for Cromwell European Real Estate Investment Trust the TSR over the last 5 years was -17%, which is better than the share price return mentioned above. And there’s no prize for guessing that the dividend payments largely explain the divergence!
A Different Perspective
Cromwell European Real Estate Investment Trust shareholders are down 5.0% for the year (even including dividends), but the market itself is up 1.4%. However, keep in mind that even the best stocks will sometimes underperform the market over a twelve month period. Unfortunately, last year’s performance may indicate unresolved challenges, given that it was worse than the annualised loss of 3% over the last half decade. Generally speaking long term share price weakness can be a bad sign, though contrarian investors might want to research the stock in hope of a turnaround. It’s always interesting to track share price performance over the longer term. But to understand Cromwell European Real Estate Investment Trust better, we need to consider many other factors. To that end, you should learn about the 4 warning signs we’ve spotted with Cromwell European Real Estate Investment Trust (including 2 which are a bit concerning) .
But note: Cromwell European Real Estate Investment Trust may not be the best stock to buy. So take a peek at this free list of interesting companies with past earnings growth (and further growth forecast).
Please note, the market returns quoted in this article reflect the market weighted average returns of stocks that currently trade on Singaporean exchanges.
Have feedback on this article? Concerned about the content? Get in touch with us directly. Alternatively, email editorial-team (at) simplywallst.com.
This article by Simply Wall St is general in nature. We provide commentary based on historical data and analyst forecasts only using an unbiased methodology and our articles are not intended to be financial advice. It does not constitute a recommendation to buy or sell any stock, and does not take account of your objectives, or your financial situation. We aim to bring you long-term focused analysis driven by fundamental data. Note that our analysis may not factor in the latest price-sensitive company announcements or qualitative material. Simply Wall St has no position in any stocks mentioned.
(Bloomberg) — Pressure at regional banks, a continuing downturn in US office prices and elevated interest rates have money managers piling back into bearish wagers on one of their favorite sectors: commercial property.
Most Read from Bloomberg
Data center real estate investment trust Equinix Inc. slumped to the lowest since January on Wednesday after Hindenburg Research said it was betting against the firm’s shares, while S&P Global said earlier this month that REITs are the most shorted stocks globally.
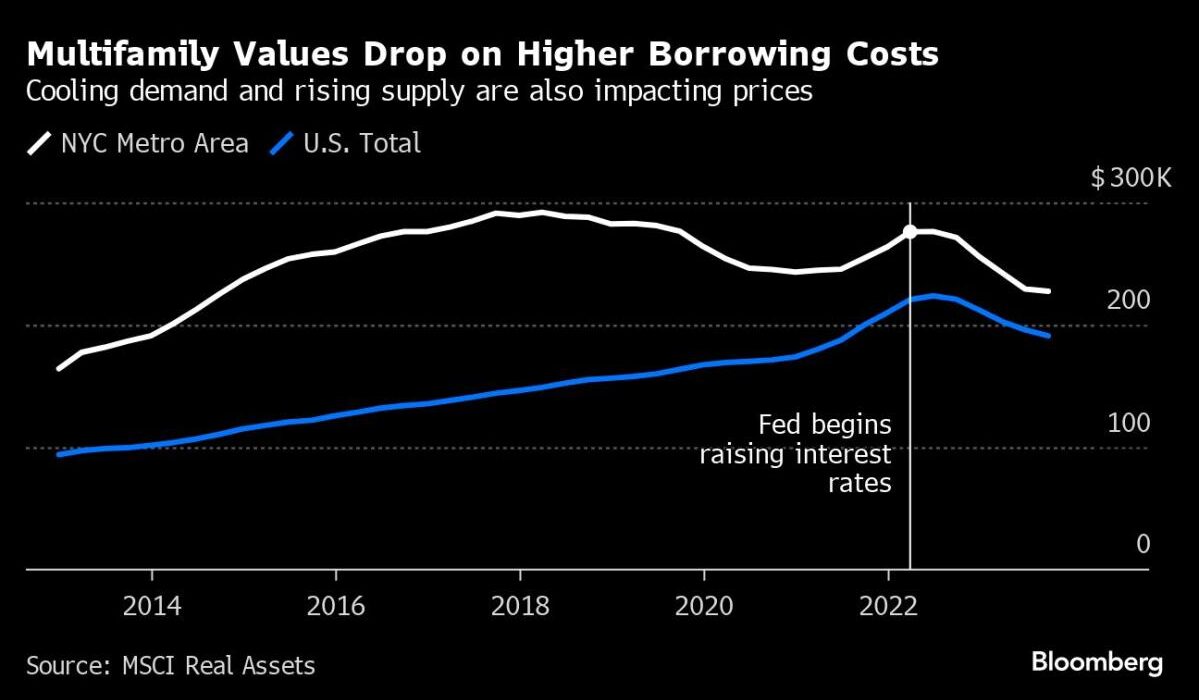
Investors have been rattled in recent weeks by lenders including New York Community Bancorp. and Deutsche Pfandbriefbank AG setting aside larger provisions for property-loan losses. The ongoing vulnerability in offices saw those property values plunge 15.2% in the year through February in the US, according to an MSCI Real Assets report published Wednesday.
“Investors are finally waking up to the fact that rates are not going back to anywhere close to zero and the office sector has changed forever,” said Daniel McNamara, founder of Polpo Capital Management, who’s shorting the sector.
Short sellers borrow stock and sell it, betting they can profit by buying it back at a lower price later. They are also using credit derivatives and indexes and equities to bet against landlords, their debt and their lenders.
Almost 13% of NYCB shares are currently being shorted, up from 3% in November, according to S&P Global. One of the reasons is that the lender is a major player in New York multifamily apartment buildings with rents controlled or stabilized, the value of which have been falling swiftly.
Muddy Waters founder Carson Block told Bloomberg Television that concerns about emerging distress in multifamily housing is one reason his firm has grown “more bearish” on Blackstone Mortgage Trust since disclosing its short position in the lender in December, adding it could also have a knock-on effect for smaller lenders.
Almost three quarters of shares in the SPDR S&P Regional Banking ETF are sold short, an increase of more than 10 percentage points since the start of last week.
The latest spurt in short bets comes as investors scale back expectations on the timing for rate cuts that might bring relief to the sector, with US central bankers signaling they’re in no major rush to start monetary easing after a series of aggressive hikes.
A recovery in office property in the US will be more protracted than following the financial crisis, Fitch Ratings said in a report on Wednesday. The ratings company projects the CMBS office delinquency rate there to reach almost 10% in 2025, surpassing the peak after the global financial crisis.
Concerns are mounting that problems in commercial real estate may reverberate. More than 40% of fund managers surveyed by Bank of America Corp. now view US commercial real estate as the most likely source of a systemic credit event, compared with fewer than one in four in January.
Already, the distress emerging in lending to apartment complexes means investors are also paying increased attention to the performance of commercial real estate collateralized loan obligations as those debts comes due for repayment.
CRE CLOs bundle up floating-rate short-term loans that are typically used to acquire and renovate rental complexes. Those borrowers have been struggling after being hit by higher interest rates and falling valuations in some markets.
Short interest in Arbor Realty Trust, one of the finance companies that issues the securities, is about 34.5% of outstanding shares compared with about 21% in September, according to data compiled by S&P Global data.
Offering Scrapped
Landlords are also being targeted. Hindenburg alleges that Equinix, which dropped a planned bond offering after the short seller’s report was published, manipulates its accounting. The company is investigating the claim and will respond in due course, a spokesperson said.
Elsewhere, short interest in Hudson Pacific Properties Inc. had surged to almost 11% of outstanding shares earlier this week, the highest level since October, from about 7% at the start at the month, the S&P Global data show. Wagers against Boston Properties have ticked up to almost 2.2%, compared with about 1.2% in December, though that’s still well below the 8.6% level reached in the middle of last year.
Most REITs focus on owning the best buildings so they will avoid many of the obstacles faced by owners of poorly located or lower quality properties, said Kevin Brown, an equity analyst at Morningstar. He expects the real estate market will stabilize over the long term and office landlords won’t have to offer incentives to lure tenants — but he doesn’t anticipate a massive recovery.
“There’s still going to be office demand, but it’s not going to be what it was in 2019,” he said.
A spokesman for Blackstone Mortgage Trust said the firm increased liquidity to near-record levels and reduced leverage while maintaining strong earnings. Arbor declined to comment, while Hudson Pacific and Boston Properties didn’t respond to a request for comment. A representative for NYCB also didn’t immediately respond to requests for comment.
Falling Values
While commercial real estate prices have been falling, private equity buyers have been largely on the sidelines waiting for more distress to emerge as borrowers begin to default and loans sour. That may be changing now, with Blackstone Inc. President Jon Gray saying this month that values are bottoming and there’s an opportunity to buy assets from banks and insurance funds that may have to sell at discounts.
Another source of sales may be property funds, which have experienced a spike in withdrawals in recent months. Investors yanked almost €1.3 billion from European funds in February, compared with just over €25 million a year earlier, according to data compiled by Morningstar, as values decline.
For example, Credit Suisse Real Estate Fund International lost 22% on investments in 2023 as the downturn in global property markets continued. By the end of last year, investors had requested the asset manager redeem about 23% of the units in the fund, according to the filing.
For now, offices remain the most visible source of distress in commercial real estate. Those buildings are the collateral for more than 20% of commercial property loans set to mature in 2024, according to MSCI Real Assets, which said that landlords may have a more difficult time qualifying for a loan extension that those of other assets.
“Even in January of this year, the market was pricing in six to seven cuts from the Fed and people were holding out hope that a recession will cure the work from home attitude of the masses,” McNamara said. “Unfortunately for them, both those things were fantasies.”
–With assistance from Sonali Basak.
(Adds Fitch property outlook in the 10th paragraph. An earlier version was corrected to clarify that Blackstone’s Gray said values are bottoming instead of bottomed in the 19th paragraph.)
Most Read from Bloomberg Businessweek
©2024 Bloomberg L.P.
/NOT FOR DISTRIBUTION TO UNITED STATES NEWSWIRE SERVICES OR FOR DISSEMINATION IN THE UNITED STATES/
WINNIPEG, MB, March 15, 2024 /CNW/ – Marwest Apartment Real Estate Investment Trust (the “REIT”) (TSXV: MAR.UN) reported financial results for the year ended December 31, 2023. This press release should be read in conjunction with the REIT’s Consolidated Financial Statements and Management’s Discussion and Analysis (“2023 Annual MD&A”) for the year ended December 31, 2023, which are available on the REIT’s website at www.marwestreit.com and at www.sedarplus.ca1.

Mr. William Martens, Chief Executive Officer and Trustee commented, “In 2023 we were able to grow our NAV from $1.44 per Unit to $1.90 per Unit. The REIT has benefitted from the current economic pressures which continue to limit the amount of housing supply in the market resulting in lower vacancy rates and higher rental rates. Management expects similar demand and low vacancy rates to continue throughout 2024.”
2023 Annual Highlights
-
Increased distributions by 2% to Unitholders on record at August 31, 2023
-
Reported Net Asset Value per Unit (“NAV“) of $1.90 at December 31, 2023 compared to $1.44 at December 31, 2022
-
Same Property Net Operating Income1 (“Same Property NOI“) increased by 14.71% in 2023 compared to 2022
-
Reported funds from operations (“FFO“) per Unit of $0.0970 for the year ended December 31, 2023, compared to $0.0796 for 2022
-
Reported adjusted funds from operations (“AFFO“) per Unit of $0.0936 for year ended December 31, 2023, compared to $0.0694 for 2022
-
Average Occupancy rate of 99.00% reported for the year ended December 31, 2023
Operations Summary
|
Year ended |
Year ended |
||
|
Portfolio Operational Information |
|||
|
Number of properties |
4 |
4 |
|
|
Number of suites |
516 |
516 |
|
|
Average Occupancy Rate |
99.00 % |
97.23 % |
|
|
Average rental rate |
$1,540 |
$1,511 |
|
|
Same property Net Operating Income |
$ 4,614,455 |
$ 4,022,639 |
|
|
Three months ended |
Year ended |
|||
|
December 31 |
December 31 |
|||
|
Reconciliation of Same Property NOI2 to IFRS |
2023 |
2022 |
2023 |
2022 |
|
Revenue from investment properties |
$1,916,224 |
$ 1,781,187 |
$7,093,994 |
$ 6,698,998 |
|
Expenses: |
||||
|
Property operating expenses |
551,655 |
503,809 |
1,878,301 |
2,025,945 |
|
Realty taxes |
145,066 |
162,967 |
601,238 |
650,414 |
|
Total property operating expenses |
696,721 |
666,776 |
2,479,539 |
2,676,359 |
|
Same Property NOI2 |
$1,219,503 |
$ 1,114,411 |
$4,614,455 |
$ 4,022,639 |
|
1 This news release contains certain non-IFRS and other financial measures. Refer to “Notice with respect to Non-IFRS Measures” in this news release for a complete list of measures and their meaning. |
|
2 Same Property Portfolio consists of 3 multi-residential properties owned by the REIT for comparable periods in Q4 2023 and Q4 2022 – See “Notice with respect to Non-IFRS Measures” below. |
|
Reconciliation of Debt-to-Gross Book Value ratio |
|
|
Total interest–bearing debt |
$100,767,840 |
|
Total assets on balance sheet |
139,770,463 |
|
Debt-to-Gross Book Value ratio |
72.10 % |
|
Reconciliation of Debt Service Coverage ratio |
|
|
|
$ 6,359,930 |
|
Mortgage payments for the year ended December 31, 2023 |
4,899,297 |
|
Debt Service Coverage ratio |
1.30 |
|
Weighted average term to maturity on fixed rate debt |
67.30 months |
|
Weighted average interest rate on fixed debt |
3.01 % |
Financial Summary
The REIT generated FFO and AFFO per Unit of $0.0970 and $0.0942, respectively, during the year ended December 31, 2023.
|
Reconciliation of Net Income (Loss) and |
Three months ended |
Year ended |
||
|
December 31 |
December 31 |
|||
|
2023 |
2022 |
2023 |
2022 |
|
|
Revenue from investment properties |
$2,521,270 |
$ 2,253,104 |
$9,958,861 |
$7,170,916 |
|
Property operating expenses |
(675,977) |
(620,091) |
(2,695,493) |
(2,144,127) |
|
Realty taxes |
(225,864) |
(236,430) |
(903,438) |
(721,977) |
|
Net Operating Income |
1,619,429 |
1,396,583 |
6,359,930 |
4,304,812 |
|
NOI Margin |
64.23 % |
61.98 % |
63.86 % |
60.03 % |
|
General and administrative |
(308,952) |
(208,624) |
(887,564) |
(715,467) |
|
Finance costs |
(932,431) |
(836,569) |
(3,745,064) |
(2,193,845) |
|
Fair value gain (loss) on: |
||||
|
Investment properties |
4,337,052 |
(2,561,638) |
7,510,095 |
2,079,396 |
|
Unit-based compensation |
(49,067) |
(2,170) |
5,944 |
13,575 |
|
Warrants liability |
– |
– |
– |
21,359 |
|
Exchangeable Units |
(3,686,033) |
(650,476) |
(542,063) |
(108,412) |
|
Net income (loss) and |
||||
|
comprehensive income (loss) |
$ 979,998 |
$(2,862,894) |
$8,701,278 |
$3,401,418 |
|
Three months ended |
Year ended |
|||
|
December 31 |
December 31 |
|||
|
Reconciliation of FFO |
2023 |
2022 |
2023 |
2022 |
|
Net income (loss) and comprehensive income (loss) |
979,998 |
(2,862,894) |
8,701,278 |
3,401,418 |
|
Distributions on Exchangeable Units |
41,468 |
40,607 |
163,968 |
162,617 |
|
Fair value (gain) loss on investment properties |
(4,337,052) |
2,561,638 |
(7,510,095) |
(2,079,396) |
|
Fair value loss (gain) on unit-based compensation |
49,067 |
2,170 |
(5,944) |
(13,575) |
|
Fair value gain on warrant liability |
– |
– |
– |
(21,359) |
|
Fair value loss on Exchangeable Units |
3,686,033 |
650,476 |
542,063 |
108,412 |
|
FFO |
419,514 |
391,997 |
1,891,270 |
1,558,117 |
|
Weighted average number of Units |
19,498,838 |
19,508,838 |
19,501,276 |
19,565,490 |
|
FFO/unit |
$ 0.0215 |
$ 0.0201 |
$ 0.0970 |
$ 0.0796 |
|
Reconciliation of AFFO |
||||
|
FFO |
$ 419,514 |
$ 391,997 |
$1,891,270 |
$1,558,117 |
|
Capital expenditures |
(10,560) |
(65,702) |
(52,729) |
(167,845) |
|
Leasing costs |
(2,388) |
(368) |
(14,146) |
(32,183) |
|
AFFO |
406,566 |
325,927 |
1,824,395 |
1,358,089 |
|
Weighted average number of Units |
19,498,838 |
19,508,838 |
19,501,276 |
19,565,490 |
|
AFFO/unit |
$ 0.0209 |
$ 0.0167 |
$ 0.0936 |
$ 0.0694 |
|
AFFO payout ratio |
18.34 % |
22.45 % |
16.17 % |
21.61 % |
|
NAV and NAV per Unit Reconciliation |
At December 31, 2023 |
At December 31, 2022 |
|
Unitholders’ Equity |
$ 27,578,331 |
$ 19,014,023 |
|
Exchangeable Units |
9,757,146 |
9,215,083 |
|
NAV |
37,335,477 |
28,229,106 |
|
Trust Units |
8,657,564 |
8,667,564 |
|
Exchangeable Units |
10,841,274 |
10,841,274 |
|
Deferred Units |
167,265 |
110,036 |
|
Total Units oustanding |
19,666,103 |
19,618,874 |
|
NAV per unit |
$ 1.90 |
$ 1.44 |
The overall increase in NAV from $1.44 at December 31, 2022 to $1.90 at December 31, 2023, was due compression of capitalization rates in the valuation of the portfolio compared to 2022, as well as market conditions throughout all properties and net operating income less finance costs and general and administrative expenses exceeding distributions.
Outlook
Management is focused on growing the portfolio and unitholder value through increasing rental rates where the market allows, future acquisition opportunities that will increase the overall size and performance of the REIT, as well as maintaining a manageable debt structure. The current debt of the REIT is all fixed rates with an average remaining mortgage term of over five years. The majority of the REIT’s debt is CMHC insured.
Subsequent to year end, the Element Phase I debt that matured on January 1, 2024 was refinanced with a CMHC insured mortgage with a term of 10 years, interest rate of 4.3% and amortization of 40 years. The total debt advanced was, including $347,700 of CMHC premiums and fees, $8,387,700.
Management believes the organic growth in NAV due to paydown of debt over the mortgage terms is a positive outcome of the higher leveraged position as well as lowering the REIT’s debt to GBV ratio and thereby increasing the NAV per Unit over time.
Management anticipates the demand for rental housing to continue to grow in the coming quarters due to increasing immigration and the affordability gap in rental vs. home ownership. As interest rates maintain their current levels, the cost of home ownership remains elevated.
The increase in the portfolio’s operating costs due to inflation may be offset by increases in rental rates, where the market allows, as 56 percent of the portfolio at December 31, 2023 is not under rent control or restrictive financing agreements.
About Marwest Apartment Real Estate Investment Trust
The REIT is an unincorporated open-ended trust governed by the laws of the Province of Manitoba. The REIT was formed to provide holders of Units with the opportunity to invest in the Canadian multi-family rental sector through the ownership of high-quality income-producing properties, with an initial focus on stable markets throughout Western Canada.
Forward-looking Statements
The information in this news release includes certain information and statements about management’s views of future events, expectations, plans and prospects that constitute forward‐looking statements. These statements are based upon assumptions that are subject to significant risks and uncertainties. Because of these risks and uncertainties and as a result of a variety of factors, the actual results, expectations, achievements or performance may differ materially from those anticipated and indicated by these forward‐looking statements. A number of factors could cause actual results to differ materially from these forward‐looking statements, including the risks described under the heading “Risk Factors” in the REIT’s latest annual information form and management’s discussion and analysis. The payment of cash distributions will be dependent upon a number of factors, including but not limited to the financial performance, financial condition and financial requirements of the REIT. Although management of the REIT believes that the expectations reflected in forward‐looking statements are reasonable, it can give no assurances that the expectations of any forward‐looking statements will prove to be correct. Except as required by law, the REIT disclaims any intention and assumes no obligation to update or revise any forward‐looking statements to reflect actual results, whether as a result of new information, future events, changes in assumptions, changes in factors affecting such forward‐looking statements or otherwise.
Neither the TSXV nor its Regulation Services Provider (as that term is defined in the policies of the TSXV) accepts responsibility for the adequacy or accuracy of this news release.
The Units are not registered under the United States Securities Act of 1933, as amended (the “U.S. Securities Act”) and may not be offered or sold within the United States or to or for the account or benefit of U.S. persons, except in certain transactions exempt from the registration requirements of the U.S. Securities Act. This press release does not constitute an offer to sell, or the solicitation of an offer to buy, securities of the REIT in the United States or in any other jurisdiction.
Notice with respect to Non-IFRS Measures Disclosure
The REIT’s financial statements are prepared in accordance with IFRS. In addition to IFRS measures, this news release and the REIT’s Annual 2023 MD&A disclose certain non-IFRS financial measures that are commonly used by Canadian real estate investment trusts as an indicator of performance. Non-IFRS measures and ratios include the following:
Net Operating Income (“NOI”)
The Trust calculates net operating income as revenue less property operating expenses such as utilities, repairs and maintenance and realty taxes. Charges for interest or other expenses not specific to the day‑to‑day operations of the Trust’s properties are not included. The Trust regards NOI as an important measure of the income generated by income-producing properties and is used by management in evaluating the performance of the Trust’s properties. NOI is also a key input in determining the value of the Trust’s properties. For reconciliation to IFRS measures, refer to “Financial Operations and Results” in the REIT’s Annual 2023 MD&A
Funds from Operations (“FFO”)
The Trust calculates FFO substantially in accordance with the guidelines set out in the white paper titled “White Paper on Funds from Operations & Adjusted Funds from Operations for IFRS” by the Real Property Association of Canada (“REALpac”) as revised in January 2022. FFO is defined as IFRS consolidated net income adjusted for items such as unrealized changes in the fair value of the investment properties, effects of puttable instruments classified as financial liabilities and changes in fair value of financial instruments and derivatives. FFO should not be construed as an alternative to net income or cash flows provided by or used in operating activities determined in accordance with IFRS. The Trust regards FFO as a key measure of operating performance. For reconciliation to IFRS measures, refer to “Financial Operations and Results” in the REIT’s Annual 2023 MD&A
Adjusted Funds from Operations (“AFFO”)
The Trust calculates AFFO substantially in accordance with the guidelines set out in the white paper titled “White Paper on Funds from Operations & Adjusted Funds from Operations for IFRS” by REALpac as revised in January 2022. AFFO is defined as FFO adjusted for items such as maintenance capital expenditures and straight‑line rental revenue differences. AFFO should not be construed as an alternative to net income or cash flows provided by or used in operating activities determined in accordance with IFRS. The Trust regards AFFO as a key measure of operating performance. The Trust also uses AFFO in assessing its capacity to make distributions. For reconciliation to IFRS measures, refer to “Financial Operations and Results” in the REIT’s Annual 2023 MD&A
The following other non‑IFRS measures (including non-IFRS ratios) are defined as follows:
-
“FFO per unit” is calculated as FFO divided by the weighted average number of Trust Units and Exchangeable Units of the Partnership outstanding over the period.
-
“AFFO per unit” is calculated as AFFO divided by the weighted average number of Trust Units and Exchangeable Units of the Partnership outstanding over the period.
-
“AFFO Payout Ratio” is the proportion of the total distributions on Trust Units and Exchangeable Units of the Partnership to AFFO per Unit.
-
“Net Asset Value” is calculated as the sum of unitholders’ equity and Exchangeable Units
-
“Net Asset Value per Unit” or “NAV per Unit” is calculated as the sum of unitholders’ equity and Exchangeable Units divided by the sum of Trust Units, Exchangeable Units and Deferred Units outstanding at the end of the period.
-
“Debt‑to‑Gross Book Value ratio” is calculated by dividing total interest‑bearing debt consisting of mortgages by total assets and is used as the REIT’s primary measure of its leverage.
-
“Debt Service Coverage ratio” is the ratio of NOI to total debt service consisting of interest expenses recorded as finance costs and principal payments on mortgages.
-
“Stabilized net operating income” is the estimated 12-month net operating income that a property could generate at full occupancy, less a vacancy rate and stable operating expenses.
-
“Average occupancy rate” is defined as the ratio of occupied suites to the total suites in the portfolio for the period.
-
“Same Property NOI” is defined as Net Operating Income from properties owned by the REIT throughout comparative periods, which removes the impact of situations that result in the comparative period to be less meaningful, such as acquisitions, or properties going through a lease-up period.
Management believes that these measures are helpful to investors because, while not necessarily calculated comparably among issuers, they are widely recognized measures of the REIT’s performance and tend to provide a relevant basis for comparison among real estate entities. These non-IFRS financial measures are not defined under IFRS and are not intended to represent financial performance, financial position or cash flows for the period and should not be viewed as an alternative to net income, cash flow from operations or other measures of financial performance calculated in accordance with IFRS.
The above non-IFRS measures are not standardized under the financial reporting framework used to prepare the financial statements of the REIT. Readers should be further cautioned that the above measures as calculated by the REIT may not be comparable to similar measures presented by other issuers. For further information, refer to the sections entitled “Non-IFRS measures” and “Financial Operations and Results” in the REIT’s Annual 2023 MD&A, which is incorporated by reference herein, for further information (available on SEDAR at www.sedarplus.ca or the REIT’s website www.marwestreit.com).
SOURCE Marwest Apartment Real Estate Investment Trust

View original content to download multimedia: http://www.newswire.ca/en/releases/archive/March2024/15/c0020.html
-
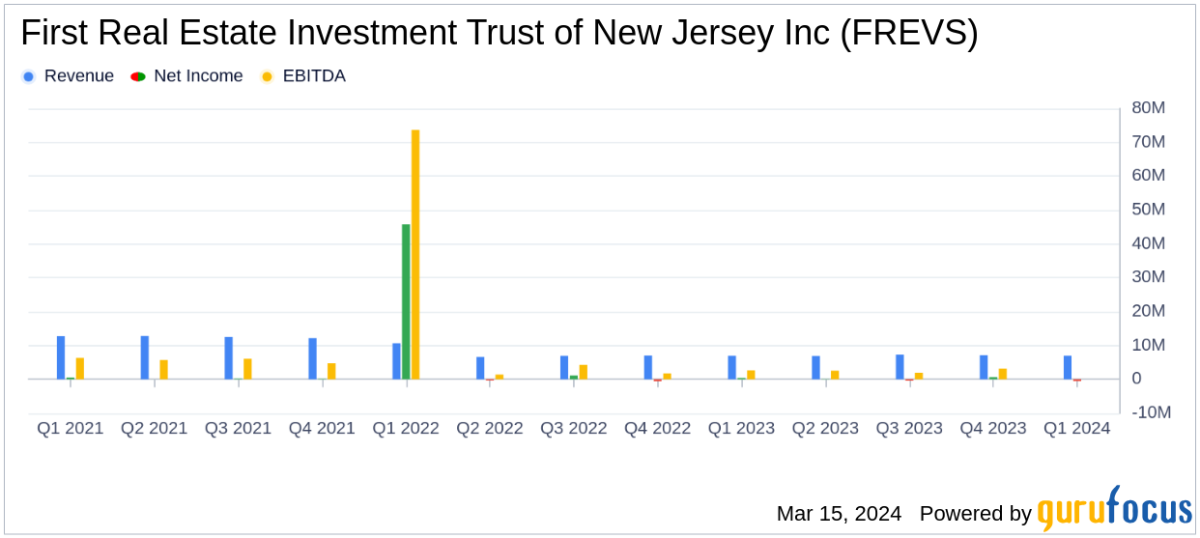
Net Loss: FREVS reported a net loss of approximately $512,000, a decrease from the prior year’s net income of $419,000.
-
Earnings Per Share: Basic and diluted loss per share stood at $0.07, compared to earnings of $0.06 per share in the same quarter last year.
-
Revenue: Total real estate revenue saw a marginal increase of 0.3% year-over-year, reaching approximately $6,999,000.
-
Occupancy Rates: Residential occupancy remained high at 95.3%, while commercial occupancy dropped significantly to 50.1%.
-
AFFO: Adjusted Funds From Operations per share decreased to $0.04 from $0.17 year-over-year.
-
Dividends: The company maintained its dividend at $0.05 per share.
On March 15, 2024, First Real Estate Investment Trust of New Jersey Inc (FREVS) released its 8-K filing, detailing the financial results for the first fiscal quarter ended January 31, 2024. The company, which specializes in owning and managing residential and commercial properties primarily in New Jersey and New York, faced a challenging quarter marked by a slight increase in revenue but a notable decline in net income.

Performance Overview
The company’s total real estate revenue inched up to approximately $6,999,000, a 0.3% increase from the previous year’s figure of $6,979,000. This was largely due to an increase of approximately $340,000 in base rents from the residential segment, which helped to counterbalance a decline in average occupancy rates from 96.8% to 95.3%. However, the commercial segment experienced a decrease in revenue of approximately $273,000, primarily due to a significant drop in occupancy rates from 66.4% to 50.1%, following the departure of Kmart from the Westwood Plaza Shopping Center.
The net loss of approximately $512,000, or $0.07 per share, contrasted with the net income of $419,000, or $0.06 per share, reported in the same quarter of the previous year. The decline in net income was mainly attributed to an increase in general and administrative expenses, which rose by about $981,000. This increase was largely due to costs associated with a financial advisory firm and legal expenses related to ongoing proceedings between FREIT and Sinatra Properties, LLC.
Financial Highlights and Challenges
Segment Property Net Operating Income (NOI) for residential properties showed a modest increase, while NOI for commercial properties saw a decrease, reflecting the challenges faced in the commercial real estate market. The company also reported financing updates, including the full repayment of a $7.5 million loan on a residential property, which is expected to result in annual debt service savings of approximately $558,000.
Adjusted Funds From Operations (AFFO), a key metric for REITs, decreased to $0.04 per share from $0.17 in the prior year’s comparable period. This decline in AFFO is significant as it may impact the company’s ability to sustain dividend payments and fund operations or growth initiatives.
The Board of Directors declared a first quarter dividend of $0.05 on the common stock, consistent with the previous year’s dividend, and will continue to evaluate the dividend on a quarterly basis.
Looking Ahead
While the company’s residential segment remains robust, the substantial drop in commercial occupancy poses a challenge for future revenue streams. The management’s efforts to negotiate loan terms and manage financing costs will be crucial in navigating the current real estate market conditions.
First Real Estate Investment Trust of New Jersey Inc’s portfolio diversification between residential and commercial properties provides some stability, but the company will need to address the challenges in its commercial segment to improve its financial performance and maintain investor confidence.
For further details and to stay updated on FREIT’s performance, investors are encouraged to visit the company’s website and review their filings with the SEC.
Explore the complete 8-K earnings release (here) from First Real Estate Investment Trust of New Jersey Inc for further details.
This article first appeared on GuruFocus.

TORONTO, March 14, 2024 /CNW/ – Northwest Healthcare Properties Real Estate Investment Trust (the “REIT” or “Northwest”) (TSX: NWH.UN), a leading global owner and manager of healthcare real estate infrastructure in the Americas, Australasia, and Europe, announces results for the three months and year ended December 31, 2023.

2023 Fourth Quarter Financial and Operational Highlights:
For the three months (“Q4 2023”) and year ended December 31, 2023, the REIT delivered strong operating results with key highlights as follows:
-
Revenue from investment properties for Q4 2023 and year ended December 31 of $124.0 million and $508.0 million, respectively, was 4.1% and 12.3% higher in Q4 2023 compared to Q4 2022, respectively, primarily from rental lease indexation and full year of US portfolio acquisition.
-
Same property net operating income (“SPNOI”) of $90.9 million was 4.0% higher in Q4 2023 compared to Q4 2022, and annual SPNOI of $293.4 million increased 3.7% from $283.1 million in 2022 (see Exhibit 1).
-
Strong operating performance is underpinned by a long-term lease maturity profile with a weighted-average lease expiry (“WALE”) of 13.3 years, a global portfolio occupancy rate of 97%, and a global rent collection rate of 99%.
-
Adjustments to investment property fair values, and higher interest expense for variable rate debts resulted in net income (loss) for the Q4 2023 and year ended December 31, 2023, of $(188.9) million and $(480.7) million in 2023, respectively, compared to $(135.5) million and $125.6 million in 2022, respectively.
-
Higher interest expense represents an effective weighted-average interest rate (“WAIR”) of 6.27% as at December 31, 2023, compared to 5.35% as at December 31, 2022.
-
Adjusted funds from operations (“AFFO”) for Q4 2023 was $0.13(1) per unit (Q4 2022 – $0.17 per unit), resulting in an AFFO payout ratio for Q4 2023 of 67% (Q4 2022 – 117%) (see Exhibit 3).
Selected Financial Information:
|
(unaudited) ($000’s, except unit and per unit amounts) |
Three months ended |
Three months ended |
|
Number of properties |
219 |
233 |
|
Gross leasable area (sf) |
17,736,521 |
18,635,583 |
|
Occupancy |
97 % |
97 % |
|
Weighted Average Lease Expiry (Years) |
13.3 |
13.8 |
|
Rent Collection rate |
99 % |
99 % |
|
Net Operating Income |
98,083 |
$ 92,855 |
|
Net Income (Loss) attributable to unitholders |
$ (188,900) |
$ (135,519) |
|
Funds from Operations (“FFO”) |
$ 36,759 |
$ 37,578 |
|
Adjusted Funds from Operations (“AFFO”) |
$ 32,835 |
$ 41,440 |
|
Debt to Gross Book Value – Declaration of Trust |
47.7 % |
45.3 % |
|
Debt to Gross Book Value – Including Convertible Debentures |
51.9 % |
48.5 % |
“2023 was about strengthening our business and balance sheet,” said Craig Mitchell, Northwest’s Chief Executive Officer. “As demonstrated in our financial results, we have an exceptional healthcare real estate portfolio that is performing well in a sector that is resilient and positioned for growth. It is important to highlight that the constraints we have faced as a company over the past year stemmed from balance sheet leverage and the resulting interest expense. However, our underlying real estate and business fundamentals remain strong.
“Throughout 2023, to strengthen our financial position, the REIT divested of assets valued at over $450.0 million, including non-core investment properties and unlisted securities, with the proceeds used to pay down debt. We also amended, extended, repaid and refinanced total debt facilities valued at over $1.4 billion with 2023 and 2024 maturities.
“These efforts not only immediately positively impact earnings through reducing interest expense, but also enhance the balance sheet. While there is still work ahead of us, we are confident in our ability to continue to unlock value within our portfolio.
“The REIT’s high-quality real estate portfolio with long-term leases, is well-positioned to capitalize on the heightened demand for healthcare real estate. As we look ahead, we are optimistic about the future of the real estate healthcare sector and our position within it.”
Same Property NOI
The REIT’s strong operating performance can be seen in the SPNOI for Q4 2023, which increased by 4.0% over the comparable prior year period. The property portfolio performed well with 83.1% of the property portfolio rents indexed to inflation and an 87% lease renewal rate supported by a long-term WALE of 13.3 years. These strong operating results came from all regions in the quarter with SPNOI growth coming from the Americas at 2.5%, Europe at 3.2% and Australasia at 6.5%.
Valuations
During Q4 2023 and year ended December 31, 2023, the REIT recorded a fair value loss on income producing properties of $157.6 million and $571.8 million, respectively. The fair value losses were attributable mainly to cap rate expansions in consideration of the interest rate environments in which the REIT operates. The weighted average capitalization rate increased to 5.9% for the consolidated portfolio, as compared to 5.4% December 31, 2022.
For the year ended December 31, 2023, 82% of the REIT’s investment property fair values were determined by independent third-party appraisers.
Balance Sheet Strengthening
During the second half of 2023, the REIT announced a number of initiatives to manage 2023 and 2024 debt maturities and to strengthen the balance sheet, including asset sales and the refinancing, and extension of its debt. As at December 31, 2023, the REIT had mortgages and loans payable of $3.6 billion (December 31, 2022 – $3.8 billion).
Dispositions
During 2023, the REIT divested properties with a fair value of $360.7 million with $162.8 million occurring in Q4. The proceeds were used to repay property level debt, corporate credit facilities and Australasian term debt.
In 2023, the REIT sold or redeemed approximately 63% of its investment in unlisted securities for proceeds of $134.5 million. The proceeds were used towards the full repayment of the Australasian term debt, secured by the underlying unlisted securities. In 2024 to-date, the REIT has redeemed additional unlisted securities of $15.5 million.
In 2024 to-date, the REIT divested five non-core properties at fair value of $41.8 million, with proceeds used to repay asset specific and corporate variable rate debt, and for general corporate purposes.
Capital Management
During 2023, the REIT refinanced, amended and extended $1.0 billion of term debt and credit facilities. The REIT further executed a new term loan for total proceeds of $140.0 million maturing in 2025 and completed a public offering of $86.3 million aggregate principal amount of Series I convertible debentures, which included the exercise in full of the over allotment of $11.3 million. The weighted average interest rate on debt as of December 31, 2023, is 6.27% as compared to 5.35% at December 31, 2022, including convertible debentures which had a weighted average interest rate of 7.88% in 2023 and 5.92% in 2022.
On November 27, 2023, holders of Northwest’s $125.0 million ‘Series G’ Convertible Unsecured Subordinated Debentures (TSX: NWH.DB.G) (the “Debentures”) passed an extraordinary resolution approving certain amendments to the Debentures, including an extension of the maturity of the Debentures from December 2023 to March 2025.
In the first three months of 2024, the REIT extended approximately 28% of its non-mortgage debt maturing in 2024 and 2025. This includes the extension of $125.0 million of its revolving corporate debt from 2024 to 2025, and $172.0 million of debt from 2025 to 2027.
On March 13, 2024, Vital Healthcare Property Trust (“Vital”) extended the weighted average term to maturity to approximately 4 years for $430.0 million of term debts, of which $177.0 million were maturing in 2025. The extensions are at approximately the same weighted average interest margins as current financing.
Governance Milestones
Corporate Governance
On August 8, 2023, Northwest appointed Mr. Dale Klein (formerly Lead Independent Trustee) as the REIT’s Non-Executive Chair. Ms. Laura King, Trustee, was appointed Chair of the REIT’s Compensation, Governance and Nominating Committee. Ms. Maureen O’Connell, Trustee, was appointed Chair of the Audit Committee.
On January 30, 2024, Northwest announced the retirement of Mr. Robert Baron from the Board of Trustees, effective January 29, 2024. Also on January 30, 2024, the Board appointed Mr. Robert ‘Bobby’ Julien and Mr. Graham Garner to the Board.
Management Team
On August 8, 2023, Craig Mitchell was appointed Interim CEO and Mike Brady was appointed President. On October 23, 2023, Craig Mitchell was announced as the REIT’s permanent CEO.
In February 2024, Tracey Whittall joined as the REIT’s new Chief Operating Officer (“COO”). She will be based in the Toronto corporate office and has more than 20 years of leadership experience in the financial industry. Previously, Tracey was Chief Operating Officer at Flexiti, a leading financial services company. Before joining Flexiti, Tracey had a 22-year career with CIBC, one of Canada’s largest banks.
Craig Mitchell, Northwest’s CEO states: “Northwest is very pleased to have Tracey join the Northwest team and we would also like to extend our gratitude to Peter Riggin, our outgoing COO, for his valuable contributions to the REIT during his tenure. Peter originally joined the Northwest family in 2004 as Senior Vice President, Acquisitions with the REIT’s predecessor company, where he was later appointed CEO in 2010. At Northwest, Peter held a number of important, strategic executive roles, including the REIT’s Managing Director – Canada, and Chief Administrative Officer, among other roles. We would like to thank Peter for his many years of great leadership, and we wish Peter all the best in his retirement after twenty years of service for Northwest.”
2023 ESG Global Ranking
In 2023, the REIT and Vital (which is managed by Northwest) participated in the GRESB Real Estate Assessment for the third year running.
Northwest and Vital were GRESB Sector Leaders in the Global Listed Sector’s Healthcare Standing Investments and Healthcare Development categories (Vital and Northwest came in 1st and 2nd place respectively). In the Global Sector, Healthcare Development, Vital and Northwest came in 1st and 3rd place, respectively. These results for the REIT and Vital demonstrate Northwest’s commitment to ESG best practices.
Q4 2023 Conference Call
The REIT invites you to participate in its conference call with senior management to discuss our fourth quarter 2023 results on March 15, 2024 at 10:00 AM ET.
Investors are invited to access the call by dialing 416-764-8609 or 1-888-390-0605. The conference ID is 42243950#.
Audio replay will be available from March 15, 2024 through March 22, 2024 by dialing 416-764-8677 or 1-888-390-0541. The conference replay ID is 243950#.
Vital Healthcare Property Trust
On February 15, 2024, Vital also announced its financial results for the half year ended December 31, 2023. Details on Vital’s financial results are available on Vital’s website at www.vitalhealthcareproperty.co.nz.
About Northwest Healthcare Properties Real Estate Investment Trust
Northwest Healthcare Properties Real Estate Investment Trust (TSX: NWH.UN) (Northwest) is an unincorporated, open-ended real estate investment trust established under the laws of the Province of Ontario. The REIT provides investors with access to a portfolio of high-quality international healthcare real estate infrastructure comprised as at December 31, 2023, of interests in a diversified portfolio of 219 income-producing properties and 17.7 million square feet of gross leasable area located throughout major markets in Canada, the United States, Brazil, Europe, Australia, and New Zealand. The REIT’s portfolio of medical office buildings, clinics, and hospitals is characterized by long-term indexed leases and stable occupancies. With a fully integrated and aligned senior management team, the REIT leverages approximately 300 employees in ten offices in eight countries to serve as a long-term real estate partner to leading healthcare operators.
For additional information please visit: www.nwhreit.com.
Non-IFRS Measures
Some financial measures used in this press release, such as SPNOI, Constant Currency SPNOI, FFO, FFO per Unit, AFFO, AFFO per Unit, AFFO Payout Ratio, NAV, NAV per Unit, portfolio occupancy and weighted average lease expiry, are used by the real estate industry to measure and compare the operating performance of real estate companies, but they do not have any standardized meaning prescribed by IFRS.
These non-IFRS financial measures and non–IFRS ratios should not be construed as alternatives to financial measures calculated in accordance with IFRS. The REIT’s method of calculating these measures and ratios may differ from the methods of other real estate investment trusts or other issuers, and accordingly may not be comparable. Further, the REIT’s definitions of FFO and AFFO differ from the definitions recommended by REALpac. These non- IFRS measures are more fully defined and discussed in the exhibits to this news release and in the REIT’s Management’s Discussion and Analysis (“MD&A”) for the year ended December 31, 2023, in the “Performance Measurement” and “Results from Operations” sections. The MD&A is available on SEDAR+ at www.sedarplus.ca.
Forward-Looking Statements
This press release may contain forward-looking statements with respect to the REIT, its operations, strategy, financial performance and condition. These statements generally can be identified by use of forward-looking words such as “may”, “will”, “expect”, “estimate”, “anticipate”, “intends”, “believe”, “normalized”, “contracted”, or “continue” or the negative thereof or similar variations. Examples of such statements in this press release may include statements concerning the REIT’s position as a leading healthcare real estate asset manager globally, planned asset sales, the REIT’s strategic review process, ESG initiatives, balance sheet optimization arrangements, and potential acquisitions, dispositions and other transactions The REIT’s actual results and performance discussed herein could differ materially from those expressed or implied by such statements. The forward-looking statements contained in this press release are based on numerous assumptions which may prove incorrect and which could cause actual results or events to differ materially from the forward-looking statements. Such assumptions include, but are not limited to (i) assumptions relating to completion of anticipated transactions on terms disclosed; (ii) the REIT’s properties continuing to perform as they have recently, (iii) the REIT successfully integrating past and future acquisitions, including the realization of synergies in connection therewith; (iv) various general economic and market factors, including exchange rates remaining constant, local real estate conditions remaining strong, interest rates remaining at current levels,; and (vii) the availability of equity and debt financing to the REIT. Such forward-looking statements are qualified in their entirety by the inherent risks and uncertainties surrounding future expectations, including that the proposed asset sales are not completed and that no transactions or other initiatives result from the REIT’s strategic review process. Important factors that could cause actual results to differ materially from expectations include, among other things, general economic and market factors, competition, changes in government regulations and the factors described under “Risks and Uncertainties” in the REIT’s Annual Information Form and the risks and uncertainties set out in the MD&A which are available on SEDAR+ at www.sedarplus.ca.
These cautionary statements qualify all forward-looking statements attributable to the REIT and persons acting on its behalf. Unless otherwise stated, all forward-looking statements speak only as of the date of this press release and, except as expressly required by applicable law, the REIT assumes no obligation to update such statements.
|
(1) |
AFFO per unit of $0.13 includes adjustments in respect of premiums on interest rate caps that expire during the first quarter of 2024. The interest rate cap premiums contributed $0.04 per unit of AFFO during Q4 2023. |
|
NORTHWEST HEALTHCARE PROPERTIES REAL ESTATE INVESTMENT TRUST |
||||
|
Condensed Consolidated Interim Statements of Income (Loss) and Comprehensive Income (Loss) |
||||
|
(in thousands of Canadian dollars) |
||||
|
Unaudited |
||||
|
For the three months ended December 31, |
For the year ended December 31, |
|||
|
2023 |
2022 |
2023 |
2022 |
|
|
Net Property Operating Income |
||||
|
Revenue from investment properties |
$ 123,986 |
$ 119,079 |
$ 507,996 |
$ 452,198 |
|
Property operating costs |
25,903 |
26,224 |
121,374 |
103,846 |
|
98,083 |
92,855 |
386,622 |
348,352 |
|
|
Other Income |
||||
|
Interest and other |
2,596 |
3,573 |
18,559 |
13,414 |
|
Development revenue |
— |
— |
— |
3,746 |
|
Management fees |
4,216 |
417 |
15,355 |
15,876 |
|
Share of profit (loss) of equity accounted investments |
685 |
(10,594) |
(19,232) |
11,971 |
|
7,497 |
(6,604) |
14,682 |
45,007 |
|
|
Expenses and other |
||||
|
Mortgage and loan interest expense |
57,142 |
49,859 |
224,692 |
148,634 |
|
General and administrative expenses |
12,332 |
12,310 |
57,567 |
47,870 |
|
Transaction costs |
16,294 |
12,501 |
50,982 |
28,359 |
|
Development costs |
— |
— |
— |
3,430 |
|
Foreign exchange (gain) loss |
9,993 |
(8,485) |
2,506 |
(9,262) |
|
95,761 |
66,185 |
335,747 |
219,031 |
|
|
Income before finance costs, fair value |
9,819 |
20,066 |
65,557 |
174,328 |
|
Finance costs |
||||
|
Amortization of financing costs |
(3,138) |
(2,878) |
(11,787) |
(10,702) |
|
Amortization of mark-to-market adjustment |
— |
— |
— |
719 |
|
Class B exchangeable unit distributions |
(154) |
(342) |
(1,180) |
(1,368) |
|
Fair value adjustment of Class B exchangeable units |
(34) |
1,881 |
7,524 |
7,336 |
|
Accretion of financial liabilities |
(2,556) |
(3,200) |
(9,158) |
(15,249) |
|
Fair value adjustment of convertible debentures |
13,874 |
2,313 |
40,666 |
17,205 |
|
Convertible debenture issuance costs |
(2,682) |
(14) |
(7,283) |
(7,062) |
|
Net gain (loss) on financial instruments |
(36,622) |
(1,620) |
(22,418) |
58,281 |
|
Fair value adjustment of investment properties |
(157,571) |
(147,224) |
(571,760) |
(28,800) |
|
Fair value adjustment of deferred unit plan liability |
(1,461) |
3,381 |
10,814 |
10,236 |
|
Income before taxes from continuing operations |
(180,525)
|
(127,637) |
(499,025)
|
204,924 |
|
Current tax expense |
4,457 |
4,607 |
26,972 |
21,847 |
|
Deferred tax expense (recovery) |
3,918 |
3,275 |
(45,261) |
57,450 |
|
Income tax expense (recovery) |
8.375 |
7,882 |
(18,298) |
79,297 |
|
Total net income |
$ (188,900) |
$ (135,519) |
$ (480,736) |
$ 125,627 |
|
Net income attributable to: |
||||
|
Unitholders |
$ (136,835) |
$ (100,195) |
$ (347,690) |
$ 64,295 |
|
Non-controlling interests |
(52,065) |
(35,324) |
(133,046) |
61,332 |
|
$ (188,900) |
$ (135,519) |
$ (480,736) |
$ 125,627 |
|
Financial Exhibits
Exhibit 1 – Constant Currency Same Property NOI
Constant Currency Same Property NOI, sometimes also presented as “Same Property NOI” or “SPNOI”, is a non-IFRS financial measure, defined as NOI for investment properties that were owned for a full reporting period in both the current and comparative year, subject to certain adjustments including: (i) straight-line rental revenue recognition; (ii) amortization of operating leases; (iii) lease termination fees; and (iv) non-recurring transactions that are not expected to recur (v) excluding properties held for redevelopment and (vi) excluding impact of foreign currency translation by converting the foreign currency denominated SPNOI from comparative period at current period average exchange rates. Management considers. SPNOI is more fully defined and discussed in the REIT’s MD&A (see “Performance Measurement“).
|
SAME PROPERTY NOI |
|||||||||||
|
In thousands of CAD |
Three months ended December 31, |
Year ended December 31, |
|||||||||
|
2023 |
2022 |
Var % |
2023 |
2022 |
Var % |
||||||
|
Same property NOI (1) |
|||||||||||
|
Americas |
$ 39,549 |
$ 38,604 |
2.4 % |
$ 113,979 |
$ 113,441 |
0.5 % |
|||||
|
Europe |
20,868 |
20,221 |
3.2 % |
81,824 |
78,601 |
4.1 % |
|||||
|
Australasia |
30,502 |
28,639 |
6.5 % |
97,620 |
91,041 |
7.2 % |
|||||
|
Same property NOI (1) |
$ 90,919 |
$ 87,464 |
4.0 % |
$ 293,423 |
$ 283,083 |
3.7 % |
|||||
|
Impact of foreign currency translation |
— |
(2,049) |
— |
(7,551) |
|||||||
|
Straight-line rental revenue |
994 |
694 |
1,517 |
(526) |
|||||||
|
Amortization of operating leases |
(38) |
(43) |
(163) |
(193) |
|||||||
|
Lease termination fees |
— |
34 |
227 |
55 |
|||||||
|
Other transactions |
845 |
(707) |
1,021 |
25 |
|||||||
|
Developments |
3,055 |
1,145 |
23,466 |
19,076 |
|||||||
|
Acquisitions |
49 |
18 |
48,716 |
31,586 |
|||||||
|
Dispositions |
1,719 |
5,784 |
16,279 |
20,952 |
|||||||
|
Intercompany/Elimination |
540 |
515 |
2,136 |
1,845 |
|||||||
|
NOI |
$ 98,083 |
$ 92,855 |
5.6 % |
$ 386,622 |
$ 348,352 |
11.0 % |
|||||
|
Notes: |
|
|
(1) |
Same property NOI is a non-IFRS measure, defined and discussed in the REIT’s MD&A. |
|
(2) |
NOI is an additional IFRS measure presented on the consolidated statement of income (loss) and comprehensive income (loss). NOI is defined and discussed in the REIT’s MD&A. |
Exhibit 2 – Funds From Operations Reconciliation
FFO is a supplemental non-IFRS industry wide financial measure of a REIT’s operating performance. FFO is more fully defined and discussed in the REIT’s MD&A (see “Performance Measurement” and “Funds From Operations“).
|
FUNDS FROM OPERATIONS |
||||||||||||||||||
|
Expressed in thousands of Canadian dollars, except per unit amounts |
Three months ended December 31, |
Year ended December 31, |
||||||||||||||||
|
2023 |
2022 |
Variance |
2023 |
2022 |
Variance |
|||||||||||||
|
Net income (loss) attributable to unitholders |
$ (136,836) |
$ (100,195) |
(36,641) |
$ (430,808) |
$ 64,295 |
$ (495,103) |
||||||||||||
|
Add / (Deduct): |
||||||||||||||||||
|
(i) Fair market value losses (gains) |
192,951 |
141,269 |
51,682 |
572,530 |
(64,258) |
636,788 |
||||||||||||
|
Less: Non-controlling interests’ share |
(66,530) |
(39,482) |
(27,048) |
(172,245) |
56,034 |
(228,279) |
||||||||||||
|
(ii) Finance cost – Exchangeable Unit |
154 |
342 |
(188) |
1,180 |
1,368 |
(188) |
||||||||||||
|
(iii) Revaluation of financial liabilities |
2,556 |
3,200 |
(644) |
9,158 |
15,249 |
(6,091) |
||||||||||||
|
(iv) Unrealized foreign exchange loss |
9,969 |
(7,363) |
17,332 |
3,512 |
(6,095) |
9,607 |
||||||||||||
|
Less: Non-controlling interests’ share |
(88) |
(196) |
108 |
9 |
(376) |
385 |
||||||||||||
|
(v) Deferred taxes |
3,918 |
3,275 |
642 |
(45,261) |
57,450 |
(102,712) |
||||||||||||
|
Less: Non-controlling interests’ share |
7,703 |
(383) |
8,086 |
15,348 |
(19,264) |
34,612 |
||||||||||||
|
(vi) Transaction costs |
16,328 |
12,790 |
3,538 |
56,471 |
28,851 |
27,620 |
||||||||||||
|
Less: Non-controlling interests’ share |
(1,018) |
(10) |
(1,008) |
(6,226) |
971 |
(7,197) |
||||||||||||
|
(vii) Convertible Debenture issuance |
2,682 |
14 |
2,668 |
7,283 |
7,062 |
221 |
||||||||||||
|
(vii) Net adjustments for equity |
1,838 |
14,387 |
(12,549) |
29,881 |
6,940 |
22,941 |
||||||||||||
|
(viii) Internal leasing costs |
462 |
524 |
(62) |
1,932 |
2,512 |
(580) |
||||||||||||
|
* Property taxes accounted for under |
— |
— |
— |
847 |
— |
847 |
||||||||||||
|
(xi) Net adjustment for lease amortization |
(185) |
(53) |
(132) |
(442) |
(98) |
(344) |
||||||||||||
|
(xii) Other FFO adjustments |
2,854 |
9,459 |
(6,605) |
15,089 |
17,531 |
(2,442) |
||||||||||||
|
Funds From Operations (“FFO”) (1) |
$ 36,759 |
$ 37,578 |
$ (819) |
$ 141,375 |
$ 168,172 |
$ (26,797) |
||||||||||||
|
FFO per Unit – Basic (3) |
$ 0.15 |
$ 0.16 |
$ (0.01) |
$ 0.58 |
$ 0.71 |
$ (0.13) |
||||||||||||
|
FFO per Unit – Diluted (4) |
$ 0.15 |
$ 0.15 |
$ — |
$ 0.57 |
$ 0.70 |
$ (0.13) |
||||||||||||
|
Adjusted weighted average units |
||||||||||||||||||
|
Basic (3) |
244,959,959 |
241,928,826 |
3,031,133 |
244,169,923 |
237,322,182 |
6,847,741 |
||||||||||||
|
Diluted (4) |
246,316,642 |
245,588,209 |
728,433 |
245,906,967 |
240,395,485 |
5,511,482 |
||||||||||||
|
Notes |
|||||||||||
|
(1) Other FFO adjustments include items that, in management’s view, are not reflective of recurring earnings from core operations. For the year ended December 31, 2023, other FFO adjustments included (a) $9.6 million financing costs incurred with respect to an investment in unlisted securities, (b) $1.8 million of corporate G&A expenses related to the strategic philanthropic initiatives, including $1.2 million payable in 10 years and (c) $3.3 million of corporate financing costs related to short-term financing arrangement to fund property acquisition activity that are not reflective of long-term financing costs. |
|||||||||||
|
(2) FFO is not a measure recognized under IFRS and does not have standardized meanings prescribed by IFRS. See Performance Measurements section in the REIT’s MD&A. |
|||||||||||
|
(3) Under IFRS the REIT’s Class B LP Units are treated as a financial liability rather than equity. The REIT has chosen to present an adjusted basic and diluted per unit measure that includes the Class B LP Units in basic and diluted units outstanding/weighted average units outstanding. There were 1,710,000 Class B LP Units outstanding as at December 31, 2023 and 1,710,000 outstanding as at December 31, 2022. |
|||||||||||
|
(4) Diluted units includes vested but unissued deferred trust units and the conversion of the REIT’s Convertible Debentures that would have a dilutive effect upon conversion at the holders’ contractual conversion price. Convertible Debentures are dilutive if the interest (net of tax and other changes in income or expense) per unit obtainable on conversion is less than the basic per unit measure. |
|||||||||||
Exhibit 3 – Adjusted Funds From Operations Reconciliation
AFFO is a supplemental non-IFRS financial measure of a REIT’s operating performance and is intended to reflect a stabilized business environment. The REIT calculates AFFO as FFO, plus/minus certain adjustments as detailed below. AFFO is more fully defined and discussed in the REIT’s MD&A (see “Performance Measurement” and “Adjusted Funds From Operations“).
|
ADJUSTED FUNDS FROM OPERATIONS |
|||||||||||
|
Expressed in thousands of Canadian dollars, |
Three months ended December 31, |
Year ended December 31, |
|||||||||
|
2023 |
2022 |
Variance |
2023 |
2022 |
Variance |
||||||
|
FFO (1) |
$ 36,759 |
$ 37,578 |
$ (819) |
$ 141,375 |
$ 168,172 |
$ (26,797) |
|||||
|
Add / (Deduct): |
|||||||||||
|
(i) Amortization of marked to market |
— |
— |
— |
— |
(719) |
719 |
|||||
|
(ii) Amortization of transactional deferred |
1,490 |
2,946 |
(1,456) |
6,747 |
7,787 |
(1,040) |
|||||
|
(iii) Straight-line revenue |
(1,941) |
204 |
(2,145) |
(2,628) |
39 |
(2,667) |
|||||
|
Less: non-controlling interests’ share of |
537 |
(899) |
1,436 |
(950) |
(2,322) |
1,372 |
|||||
|
(iv) Leasing costs and non-recoverable |
(3,228) |
(3,053) |
(175) |
(13,582) |
(12,050) |
(1,532) |
|||||
|
Less: non-controlling interests’ share of |
49 |
52 |
(3) |
428 |
365 |
63 |
|||||
|
(v) DUP Compensation Expense |
(696) |
4,646 |
(5,342) |
6,684 |
11,874 |
(5,190) |
|||||
|
(vi) Net adjustments for equity accounted investments |
(135) |
(34) |
(101) |
(319) |
(483) |
164 |
|||||
|
Adjusted Funds From Operations (“AFFO”) (1) |
$ 32,835 |
$ 41,440 |
$ (8,605) |
$ 137,755 |
$ 172,663 |
$ (34,908) |
|||||
|
AFFO per Unit – Basic |
$ 0.13 |
$ 0.17 |
$ (0.04) |
$ 0.56 |
$ 0.73 |
$ (0.17) |
|||||
|
AFFO per Unit – Diluted (3) |
$ 0.13 |
$ 0.17 |
$ (0.04) |
$ 0.56 |
$ 0.72 |
$ (0.16) |
|||||
|
Distributions per Unit – Basic |
$ 0.09 |
$ 0.20 |
$ (0.11) |
$ 0.65 |
$ 0.80 |
$ (0.15) |
|||||
|
Adjusted weighted average units outstanding: (2) |
|||||||||||
|
Basic |
244,959,959 |
241,928,826 |
3,031,133 |
244,169,923 |
237,322,182 |
6,847,741 |
|||||
|
Diluted (3) |
246,316,642 |
245,588,209 |
728,433 |
245,906,967 |
240,395,485 |
5,511,482 |
|||||
|
Notes |
|||||||||||
|
(1) FFO and AFFO are not measures recognized under IFRS and do not have standardized meanings prescribed by IFRS. See Performance Measurement section in the REIT’s MD&A. |
|||||||||||
|
(2) Under IFRS the REIT’s Class B LP Units are treated as a financial liability rather than equity. The REIT has chosen to present an adjusted basic and diluted per unit measure that includes the Class B LP Units in basic and diluted units outstanding/weighted average units outstanding. There were 1,710,000 Class B LP Units outstanding as at December 31, 2023 and 1,710,000 outstanding as at December 31, 2022. |
|||||||||||
|
(3) Distributions per units is a non-IFRS ratio calculated as sum of the distributions on the REIT’s units and finance costs on Class B LP Units. Management does not consider finance costs on Class B LP units to be an financing cost of the REIT but rather component of the REIT’s total distributions. Distributions is not defined by IFRS and does not have a standard meaning and may not be comparable with similar measures presented by other issuers. |
|||||||||||
SOURCE NorthWest Healthcare Properties Real Estate Investment Trust

View original content to download multimedia: http://www.newswire.ca/en/releases/archive/March2024/14/c8661.html

WINNIPEG, MB, March 4, 2024 /CNW/ – Artis Real Estate Investment Trust (“Artis”), together with its joint actors, has increased its position in Dream Office Real Estate Investment Trust (“Dream Office REIT”) (TSX: D.UN) to 16.76%.

According to Dream Office REIT’s material change report dated February 22, 2024 (the “MCR”), Dream Office REIT completed a consolidation of its voting units, including the Units (as defined below), on the basis of one post-consolidation unit for every two pre-consolidation units (the “Consolidation”). Unless otherwise specified, all unit numbers and dollar amounts in this press release are presented on a post-Consolidation basis.
As a result of purchases of REIT Units, Series A (“Units”) of Dream Office REIT, Artis, together with its joint actors, owns and exercises control and direction over an aggregate of 3,173,306 Units, representing approximately 16.76% of the 18,929,933 issued and outstanding voting units of Dream Office REIT as at February 22, 2024 (as reported in the MCR). Since June 27, 2023, the date on which Artis’s previous early warning report in respect of Dream Office REIT was filed, and specifically between August 11, 2023, and March 4, 2024, Artis, together with its joint actors, acquired an aggregate of 378,650 Units in the open market under the facilities of the Toronto Stock Exchange, representing approximately 2% of the current issued and outstanding voting units of Dream Office REIT (collectively, the “Acquisitions”). The aggregate consideration paid to acquire the Units that are the subject of the accompanying early warning report filed by Artis is $7.29 million, being 378,650 Units at an average price of $19.25 per Unit. Prior to the Acquisitions, Artis, together with its joint actors, owned and exercised control and direction over 5,589,319 Units (on a pre-Consolidation basis), representing approximately 14.77% of Dream Office REIT’s issued and outstanding voting units (on a pre-Consolidation basis and as reported in Dream Office REIT’s press release dated June 22, 2023).
The Units were acquired for investment purposes.
Artis and its joint actors may, from time to time, depending on market and other conditions, increase or decrease their respective beneficial ownership, control or direction over the securities of Dream Office REIT through market transactions, private agreements, or otherwise.
Dream Office REIT’s head office is located at 30 Adelaide Street East, Suite 301, Toronto, Ontario, M5C 3H1.
Artis’s head office is located at Suite 600, 220 Portage Avenue, Winnipeg, Manitoba, R3C 0A5.
An early warning report will be filed by Artis in accordance with applicable securities laws. For further information and to obtain a copy of the early warning report filed by Artis, please contact Heather Nikkel, Senior Vice-President – Investor Relations and Sustainability of Artis at (204) 947-1250.
Artis is a diversified Canadian real estate investment trust with a portfolio of industrial, office and retail properties in Canada and the United States. Artis’s vision is to become a best-in-class real estate asset management and investment platform focused on value investing.
SOURCE Artis Real Estate Investment Trust

View original content to download multimedia: http://www.newswire.ca/en/releases/archive/March2024/04/c7036.html
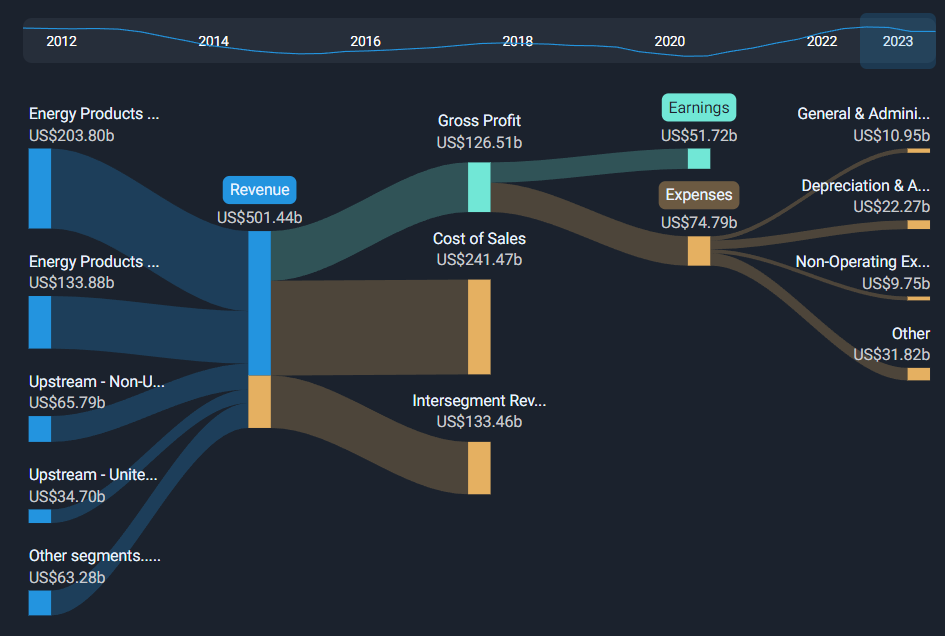
AmanahRaya Real Estate Investment Trust (KLSE:ARREIT) Full Year 2023 Results
Key Financial Results
-
Revenue: RM75.0m (flat on FY 2022).
-
Net income: RM5.04m (down 59% from FY 2022).
-
Profit margin: 6.7% (down from 17% in FY 2022).
-
EPS: RM0.009 (down from RM0.021 in FY 2022).
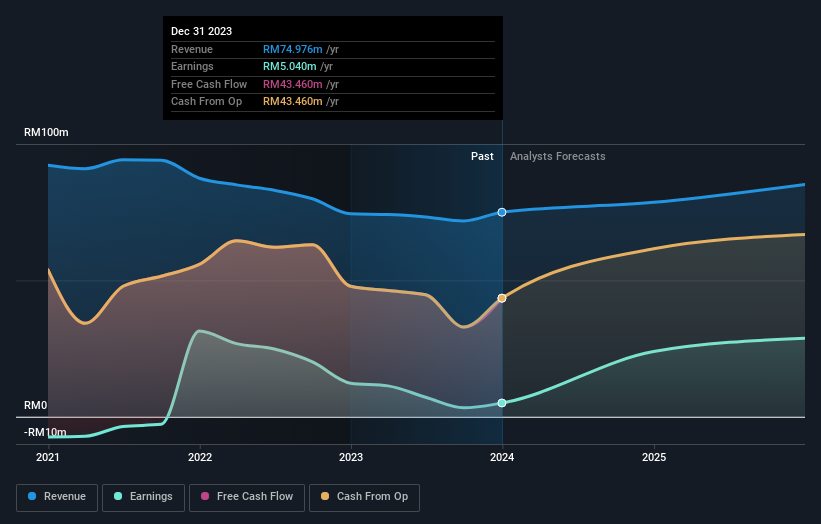
All figures shown in the chart above are for the trailing 12 month (TTM) period
AmanahRaya Real Estate Investment Trust Earnings Insights
Looking ahead, revenue is forecast to grow 6.4% p.a. on average during the next 2 years, compared to a 2.6% growth forecast for the REITs industry in Malaysia.
Performance of the Malaysian REITs industry.
The company’s shares are down 6.2% from a week ago.
Risk Analysis
You still need to take note of risks, for example – AmanahRaya Real Estate Investment Trust has 5 warning signs (and 1 which is potentially serious) we think you should know about.
Have feedback on this article? Concerned about the content? Get in touch with us directly. Alternatively, email editorial-team (at) simplywallst.com.
This article by Simply Wall St is general in nature. We provide commentary based on historical data and analyst forecasts only using an unbiased methodology and our articles are not intended to be financial advice. It does not constitute a recommendation to buy or sell any stock, and does not take account of your objectives, or your financial situation. We aim to bring you long-term focused analysis driven by fundamental data. Note that our analysis may not factor in the latest price-sensitive company announcements or qualitative material. Simply Wall St has no position in any stocks mentioned.


DENVER, March 01, 2024–(BUSINESS WIRE)–Healthpeak Properties, Inc. (NYSE: PEAK), a leading owner, operator, and developer of real estate for healthcare discovery and delivery, announced today that Scott Brinker, its President and Chief Executive Officer, is scheduled to present at the Citi 2024 Global Property CEO Conference.
The presentation is scheduled for 11:40 a.m. Eastern Time on Tuesday, March 5, 2024. You can access the webcast by visiting our website at https://ir.healthpeak.com/news-events/default.aspx. A replay will be available on our website through March 5, 2025.
Additionally, Healthpeak has published an updated investor presentation in advance of upcoming investor meetings. The presentation is available on Healthpeak’s investor relations website at https://ir.healthpeak.com.
ABOUT HEALTHPEAK PROPERTIES
Healthpeak Properties, Inc. is a fully integrated real estate investment trust (REIT) and S&P 500 company. Healthpeak owns, operates, and develops high-quality real estate for healthcare discovery and delivery. For more information regarding Healthpeak, visit www.healthpeak.com.
View source version on businesswire.com: https://www.businesswire.com/news/home/20240229590461/en/
Contacts
Andrew Johns, CFA
Senior Vice President – Investor Relations
720-428-5400