
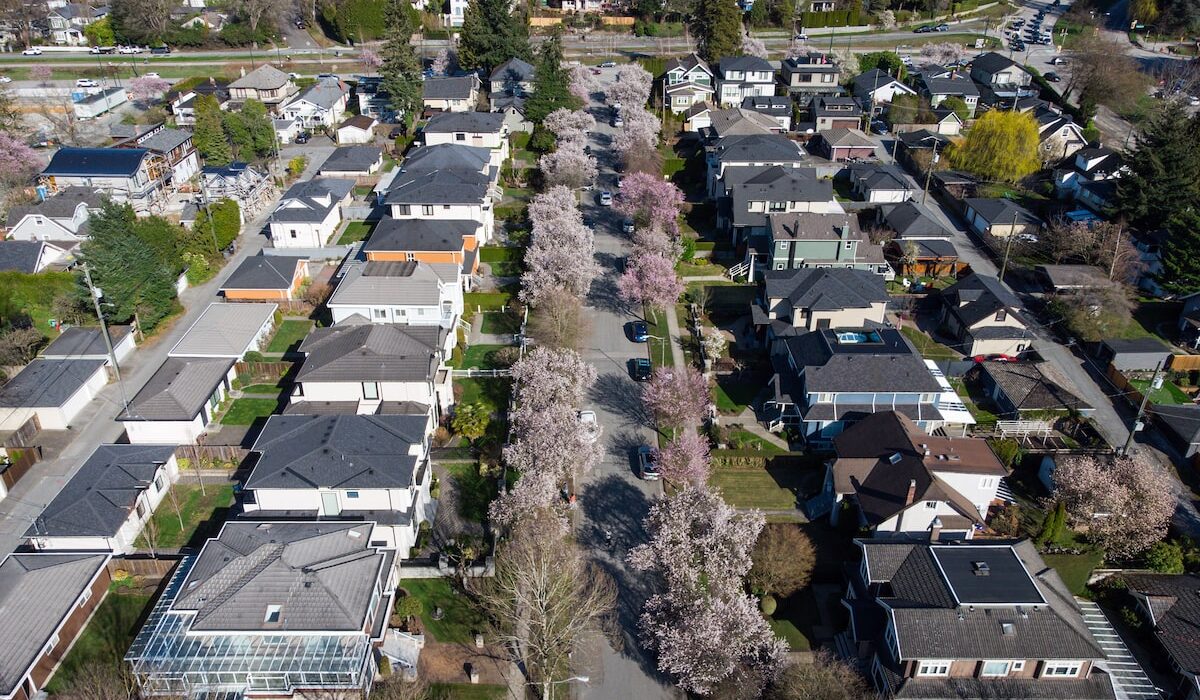
There’s a widely held belief that real estate prices will, inevitably, only rise higher and higher. There are, however, long periods when that maxim is decidedly not the case.
Toronto is a prime example. After a surge in the 1980s, the Toronto market peaked in 1989 and didn’t regain that high until 2002 – more than a decade later. A 1995 peak in Vancouver was the high-water mark until eight years later. In the United States, it took a decade after the 2006 peak before that level was seen again.
Each example is different yet each shares central elements, from burst bubbles after manias to the gyration of interest rates and economic woes. What’s clear is real estate can go sideways for a long time, even if everyone believes the natural direction is up.
As Canada works to build a path to housing affordability, the most important thing is new supply – a lot of new homes. But just as important is changing the culture, the mindset that prices are destined to escalate.
Housing has long been expensive but the situation is now extreme. Five years ago, about 60 per cent of households could afford a condo. Last year, it was less than half. And that’s for a condo.
After many years of dizzying gains in the price to buy or rent a home, it’s become widely clear that higher and higher isn’t ideal and comes with many costs.
How to restore some semblance of affordability has shot to the centre of the political debate. This week, Canada Mortgage and Housing Corp., which has called for millions of new homes, held a conference on the question in Ottawa. The Globe on Wednesday illuminated how we got here in a series of charts, from record-low rental vacancies to the way-too-long time it takes to get new housing approved and built.
Many new homes are needed, yes. As this space showed last week, a burst of construction in booming Austin, Tex., has helped reduce the price to rent.
The shift in entrenched philosophy is also necessary. We need to rein in the housing market mindset that up is good, so pervasive in North America.
The mentality leads to speculation, starting with many families betting on the ever-rising value of their home as a pot of retirement savings. Generation Squeeze, an advocacy group for younger Canadians, puts it this way: “break the addiction to high home values.”
The celebration of higher home prices is deeply ingrained. Ownership in Canada peaked in 2011 at almost seven out of 10 households. Almost all political leaders own their homes and many are landlords. That’s the reason that as things started spinning out of control in the 2010s, blame was first cast on factors such as foreigners or investor speculation without grappling with the real problem: not enough housing.
In each example of real estate markets going sideways for a long time, Toronto, Vancouver, the U.S., it was always considered bad news. The Wall Street Journal lamented Austin’s shift from “America’s hottest housing market” to “running in reverse.”
The bigger goal is to rein in prices, bring them closer to people’s incomes.
The Teranet-National Bank house price index shows the price of housing rose 4.2 per cent annually from 2000 to this year, excluding inflation. Household incomes, according to Statistics Canada, rose by far less, about 1.2 per cent a year from 2000 through 2021.
The goal of a steady surge of new supply would be to establish a lasting buyer’s market. Critics of new supply will often say it won’t ease prices but big housing investors specifically warn shareholders that “competition for residents” and an “oversupply” of homes will affect the prices they charge.
Instead of hoping and cheering prices will someday soon recoup and exceed previous highs, the target has to shift to an extended, and welcome, period of nominal gains. If home prices this century had risen at only the rate of inflation, they would be less than half of what they are – and at levels last seen in 2006. Beyond a return to affordability, a market that offered such nominal returns is what would undercut and eventually end housing speculation.
Decades of culture and policy got us here. It will take time to restore affordability. It will take time to change the culture. But as Canada sets the initial foundations to allow for many more new homes, it is starting on the path to affordability.

LONDON, March 05, 2024 (GLOBE NEWSWIRE) — Resonance is a leading adviser in tourism, real estate and economic development, and its annual Europe’s Best Cities rankings quantify and benchmark the relative quality of place, reputation and competitive identity for the continent’s urban centres.
The Best Cities data is lauded as the world’s most thorough annual city rankings, based on original methodology that analyses key statistics, user-generated reviews, social media and online activity.
The second annual Europe’s Best Cities ranking is an important, timely analysis of the urban centres that are leading the region (and planet) in post-pandemic economic recovery and a resilient future in the face of geo-political and environmental polycrisis.
Download the 2024 Europe’s Best Cities Report and all 100 city profiles at WorldsBestCities.com.
Learn more about how Resonance Consultancy can help your city and community at ResonanceCo.com.
”The 2024 Europe’s Best Cities rankings benchmark the overall performance of more than 180 principal cities in metropolitan areas with populations of more than 500,000, based on a wide variety of measures, in order to identify the Top 100 places to live, visit and invest in Europe,” says Resonance President & CEO Chris Fair.
The overall Best Cities rankings are determined by analysing the performance of each city for a wide range of factors that have historically shown positive correlations with attracting employment, investment and/or visitors to cities. Resonance groups these 27 metrics into a ranking of each city’s Livability, Lovability and Prosperity.
Based on each city’s performance across our methodology, these are Europe’s Top 10 Best Cities for 2024:
1. London, United Kingdom
2. Paris, France
3. Berlin, Germany
4. Rome, Italy
5. Madrid, Spain
6. Prague, Czechia
7. Barcelona, Spain
8. Amsterdam, Netherlands
9. Istanbul, Türkiye
10. Milan, Italy
The full ranking and extensive profiles of all 100 Europe’s Best Cities are available at WorldsBestCities.com.
About Resonance Consultancy
Resonance creates transformative strategies, brands and campaigns that empower destinations, cities and communities to realise their full potential. As leading advisors in real estate, tourism and economic development, Resonance combines expertise in research, strategy, branding and communications to make destinations, cities and developments more valuable and more vibrant. ResonanceCo.com
About World’s Best Cities
Best Cities is the home of Resonance’s exclusive ranking of the world’s top urban regions. The data is used by leading news outlets, trusted by city leaders, and is widely considered to be the world’s most comprehensive annual city ranking. Bloomberg calls it, ”The most comprehensive study of its kind; it identifies cities that are most desirable for locals, visitors, and businesspeople alike, rather than simply looking at livability or tourism appeal.” WorldsBestCities.com | #BestCities


Daniels, 50, of Berkeley, Calif., is one of hundreds of people who’ve taken advantage of an offer that made news around the world: a home in Italy for 1 euro.
In the late 2010s, towns around Italy started going viral for selling off crumbling properties for 1 euro, or roughly $1.05. The goal? To attract foreign investors to buy up the houses, rehab them and get dwindling population numbers back up.
Of course, there was a catch. In some towns, the 1-euro purchase was symbolic and just the start of more expenses down the line. In others, bids start at 1 euro but can go much higher.
There was also a big stipulation: Once buyers got their properties, they had to complete their renovations within a certain timeframe, usually three years. Costs could easily climb into the tens of thousands of euros.
Each town handles its own 1-euro program, so we don’t know exactly how many homes have been sold across Italy since the concept took off. But experts estimate the campaigns have brought in thousands of visitors who’ve bought cheap houses across the country.
How much does it really cost to buy and renovate a 1-euro home in Italy? And is taking on a major housing project across the world worth the money and the stress? CNBC Make It went to Sicily to talk to people who’ve gone through the process to find out.
Towns around Italy have gone viral in recent years for selling off abandoned homes starting at 1 euro.
Mickey Todiwala | CNBC Make It
One of the most well-known towns with a 1-euro scheme is Mussomeli, a roughly 2-hour drive south of Sicily’s capital city of Palermo. In Mussomeli, more than 100 homes have been sold for 1 euro, as well as roughly 200 so-called premium houses, which start around 5,000 euros and require fewer repairs.
Toti Nigrelli, Mussomeli’s deputy mayor who oversees the program, credits the town’s success to a user-friendly website that lays out exactly how interested homebuyers can schedule a tour and get started. Tens of thousands of requests came in “immediately” after the site launched in 2017, he says. The town made its first 1-euro sale to a Belgian visitor within two weeks.
Daniels is one of a handful of American homeowners there.
Rubia Daniels is from Berkeley, Calif., and bought several 1-euro houses in Mussomeli, Sicily.
Mickey Todiwala | CNBC Make It
She first learned about the program from her husband, who’d read about it online. Daniels, an avid traveler who works in construction, was hooked. She booked her hotel and flight out to Sicily to see if the opportunity was too good to be true.
Days into her trip in spring 2019, Daniels called her husband. They were now the proud owners of not one or two but three separate 1-euro properties in Mussomeli, she told him.
Because she works in construction, Daniels says she didn’t just see endless amounts of work in front of her. Instead, she visualized the final result of three dream projects: a vacation home, a restaurant and a wellness center.
Rubia Daniels has three dream projects: a vacation home, a restaurant and a wellness center.
Courtesy of Rubia Daniels
Once Daniels landed on her properties, she got a rundown of what the dream would actually cost. The houses were sold for 1 euro each but also incurred a 500-euro realtors fee and 2,800-euro deed. That added up to a total of 3,301 euros, or roughly $3,500, for each building.
She felt up to the challenge. Daniels went home to pack her tools and returned that summer with her husband, brother-in-law and five suitcases full of renovation supplies.
So far, she’s focused on fixing up her vacation home and initially estimated renovations to cost $20,000. Those renovation plans include a new kitchen, marble finishes, restored stone walls and a fireplace in the bathroom. Years later, she’s spent $35,000 and hopes to stay under $40,000. It’s a lot of work, but the process still feels as exciting as it did on day one, she says.
Rubia Daniels is in the process of renovating her vacation home and hopes to stay under a budget of $40,000.
Mickey Todiwala | CNBC Make It
Rubia Daniels says her background in construction is helpful to envision what her final space will look like.
Mickey Todiwala | CNBC Make It
Daniels is building the house of her dreams, “which I wouldn’t be able to do back in California because the cost would be much higher,” she says. Daniels plans to visit her Mussomeli home for vacations and split her time between California and Sicily in retirement.
Daniels is such a fan of the 1-euro initiative that she’s encouraged friends and family to take the leap. On one recent visit to Mussomeli, Daniels brought along two fellow Californians, Alfredo Ramirez and his mother, Elena, to tour the houses.
Alfredo, 35, was struck by the price difference: The amount of space he could get for 16,000 euros in Mussomeli might run him over $330,000 in Petaluma, Calif., where he lives and works in customer service.
About an hour’s drive from Mussomeli is the town of Sambuca di Sicilia. In 2019, it went viral for auctioning off old homes with bids starting at 1 euro.
There, Meredith Tabbone, 44, of Chicago, bought and renovated a 1-euro house of her own.
Meredith Tabbone is from Chicago and learned about Sambuca di Sicilia’s 1-euro home auction in 2019.
Mickey Todiwala | CNBC Make It
At the time, Tabbone was looking into getting dual citizenship in Italy, where part of her family was from before they immigrated to the U.S.
A friend told her about the Sicilian home project. “I thought it was too good to be true,” Tabbone says, “but I checked when I saw the name Sambuca and took a look, and it was the same village that my great-grandfather came from in 1902 to the United States.”
On one of the final days of the auction, Tabbone placed her bid of 5,555 euros for a property, sight unseen.
“A lot of people warned me that it could be a scam [and that] I could end up losing a lot of money,” she recalls. In May, she got the email that her bid won. She paid what she owed, plus some taxes and fees, bringing the home sale up to 5,900 euros, or roughly $6,200.
From the moment that I sent in the bid and checked my email every day and found out that I won, all the way through this process, there have been 4 million moments of frustration, exhaustion, contemplation of how to move forward.
Meredith Tabbone
1-euro homeowner from Chicago
Tabbone flew to see her new home for the first time in June 2019. She then bought the building next door through a private sale with the owner for 22,000 euros, or just over $23,000.
The additional purchase meant more space to build her dream vacation home. It also meant much higher renovation costs. What started as a 40,000-euro budget to renovate 620 square feet grew to 140,000 euros to cover 2,700 square feet.
Meredith Tabbone bid 5,555 euros on a home, sight unseen, in Sambuca, Sicily, in 2019.
Courtesy of Meredith Tabbone
After visiting her original 1-euro home, Meredith Tabbone bought the building next door for 22,000 euros to combine and create her dream vacation home.
Courtesy of Meredith Tabbone
Over the next four years, Tabbone visited Sambuca for weeks at a time to oversee a local crew for the extensive overhaul: They knocked down walls to join the properties; leveled the flooring across 18 small rooms; reinforced the structure against earthquakes; added two large terraces; and opened up the kitchen, dining and living rooms.
All in, she spent about 425,000 euros on renovations, or roughly $446,000.
Meredith Tabbone knocked down several walls to open up her kitchen, dining and living areas. She plans to use her vacation home to entertain local friends and fellow travelers.
Mickey Todiwala | CNBC Make It
Meredith Tabbone finished renovations in late 2023 and plans to spend four months out of the year in Sambuca.
Mickey Todiwala | CNBC Make It
Meredith Tabbone says she’s never done a renovation project like this before, but she was inspired by the work of her father, who was an architect.
Mickey Todiwala | CNBC Make It
“From the moment that I sent in the bid and checked my email every day and found out that I won, all the way through this process, there have been 4 million moments of frustration, exhaustion, contemplation of how to move forward,” Tabbone says.
That being said, “I never felt like this wasn’t the right place for me to be, and that this wasn’t the right project for me to work on or community to live in,” she says. “I’ve learned so much about my family, which has been really special for me because my father passed away when I was a senior in high school.”
Not all renovation plans work out. That was the case for Danny McCubbin, 59, who’s originally from Australia and was living in London when he heard about Mussomeli’s 1-euro program.
In spring 2019, he made his first visit and toured 28 houses before buying his property.
His vision was different from most: McCubbin wasn’t looking for a home to live in, but rather a space to launch a food-rescue charity, building upon his 17 years working on food-based campaigns for Jamie Oliver in London. He was inspired by his observation that lots of elderly people and families were not getting fresh food in Mussomeli.
The pandemic delayed his plans to rehab a 1-euro house for the project. The home experienced extensive water damage while he was stuck in London for 10 months. By the time he returned, his 15,000-euro quote for renovations doubled.
Danny McCubbin had to give back his 1-euro home after it experienced extensive damage, but he found a way to launch his charity, The Good Kitchen, in Mussomeli’s town square.
Mickey Todiwala | CNBC Make It
He decided to sell his house back to the real estate agency for 1 euro and found a different space to rent in the town square. His charity, The Good Kitchen, now operates from the space next door, where rent and utilities run 400 euros a month.
McCubbin says he doesn’t regret a thing: He’s grateful the scheme helped him establish his Italian residency and brought him to Mussomeli.
Locals are glad he stayed, too: Each week, volunteers at The Good Kitchen work to rescue surplus food from nearby markets and deliver grocery packages to local families in need. They also host a weekly lunch for community members.
“My dream is that one day we will be able to provide jobs, especially for young people in the town,” he says.
Mussomeli’s 1-euro campaign has already had a positive impact by bringing more foreign investment, tourism and jobs, says Nigrelli, the town’s deputy mayor.
Mussomeli had roughly 16,000 residents in the 1950s, he explains, but populations declined through the ’80s as young people left for university and better career opportunities in northern Italy. Today, roughly 9,900 people remain in town.
Mussomeli, Sicily, has seen its population decline from roughly 16,000 in the 1950s to less than 10,000 today.
Mickey Todiwala | CNBC Make It
Like many small towns in Sicily, Mussomeli doesn’t have a major university. As a result, many jobs that stay in town are concentrated in construction, agriculture and the trades. The compounding effect has left the region with a large youth unemployment problem: Roughly 32% of young Sicilians from age 15 to 29 are unemployed — one of the highest rates in Italy.
Even when young people return to Mussomeli, they can find the small town limiting. Federica Prezioso, 37, moved away to study in Palermo, Milan and London. She returned to work as a teacher and raise children, but says it’s hard to see her friends move away over time.
She’s in favor of schemes like the 1-euro home program. Large-scale renovations mean more jobs for carpenters, plumbers, electricians and other construction workers. The project even brought a wave of Argentinian doctors who moved there and resolved a shortage of health-care workers.
Toti Nigrelli is Mussomeli’s deputy mayor and helps oversee the town’s 1-euro housing program.
Mickey Todiwala | CNBC Make It
Even if prospective homebuyers or curious tourists don’t settle on a property to purchase, the increase in foot traffic has led to a boost for local restaurants, hotels and retail stores. Mussomeli’s tourism sector increased by 3,000% within the first year of launching the 1-euro home program, according to Nigrelli.
In the last seven years, Mussomeli has sold off nearly all of its 1-euro homes, another marker of success. Roughly a dozen houses are left, says Natalie Milazzo, a local real estate agent.
Meanwhile, there are over 100 premium houses currently on the market, Milazzo says. Many of them are being sold by families who’ve moved away or inherited multiple properties and see an influx of interested foreigners as an opportunity to make a profit.
With more foreign home investors and visitors come higher real estate costs. As the demand for previously worthless homes has increased, Nigrelli says, the price of homes for sale and for rent have risen by up to 100%.
This could become a problem for incoming homebuyers purchasing old properties and renting places to stay during renovations. On the other hand, Nigrelli estimates roughly 90% of Mussomeli residents already own their homes, so rising real estate prices have a smaller immediate impact on locals.
In 2021, a group of young professionals in Cammarata, Sicily, started a nonprofit called StreetTo, which works with the city to advertise 1-euro and cheap houses to foreigners. So far, the program has attracted a handful of young people and couples who move to the town to work remotely, says volunteer Martina Giracello, 31.
Gianluca Militello and Martina Giracello run StreetTo, a volunteer program that aims to attract foreign homebuyers to Cammarata, Sicily.
Mickey Todiwala | CNBC Make It
Houses that aren’t being sold for 1 euro range between 5,000 to 25,000 euros, or $5,250 to $26,250. StreetTo volunteers say they list houses at a sustainable pace to avoid gentrification and out-of-control housing prices.
“The respect of the old town is the most important thing,” Giracello says.
Gianluca Militello, 38, says volunteering with StreetTo is one of the main ways young people like him can improve their futures in Cammarata: “We want to be surrounded by people who can bring something to our own lives.”
“It’s also personal,” he adds.
Back in Mussomeli, Nigrelli says local officials across Sicily have asked him for guidance to bring 1-euro programs to their town. One recent partnership: Getting a campaign up and running in Caltanissetta, an hour’s drive east.
Daniels and Tabbone, the American homebuyers in Mussomeli and Sambuca, say their 1-euro journeys have been worth it.
Their small Sicilian towns offer a low cost of living. A nice meal out might be 10 euros or less, while a round-trip flight within Europe or to Africa might run you just 45 euros, Tabbone says.
Another big draw: the Sicilian approach to leisure, including a daily lunch and nap break from noon to 4 p.m. when most of the town shuts down.
Rubia Daniels encourages other Americans to buy into Mussomeli’s housing program because she believes it’s sustainable and good for the local economy.
Mickey Todiwala | CNBC Make It
Tabbone, who runs her own business as a financial advisor, says the slower pace of life abroad makes her want to “have the focus of my life be about just personal fulfillment in general,” rather than work.
A mentality that prioritizes leisure and socializing makes for a lower-stress life, Daniels says. “People here, they consume a lot of alcohol, nicotine, carbs, and they live longer than most places,” she points out. “I believe it’s because the level of stress is so low and [the fact that] the community is so active that that gives them longevity.”
Daniels feels strongly that historic renovation programs are beneficial in part because they’re sustainable. Around the world, “we have destroyed so much of the environment building things instead of using what exists,” she says.
Tabbone is glad to have the chance to connect with her family history and considers the Sambuca project a “huge success” for bringing attention to the village.
She’s wary of fielding questions from foreigners like herself who want to buy an old home and turn it into an investment property. “I’m very grateful that I do not know anybody doing that, because I do not want this to be a village of Airbnbs,” she says.
Meredith Tabbone says her renovation project has helped her fall in love with Sambuca, where she’s made new friends and has gotten to research her family history.
Courtesy of Meredith Tabbone
Tabbone says she will never sell her Sambuca home despite getting many offers. “I have a cousin, [and] I’ve already told her she can use the house if I pass away before her. After that, it’s going to be donated to the village.”
“A lot of people refer to this as a revival of this town,” Tabbone adds. “I like to think of it more as a renaissance.”
Conversions from euros to USD were done using the OANDA conversion rate of 1 euro to 1.05 USD on Oct 18, 2023. All amounts are rounded to the nearest dollar.
Want to land your dream job in 2024? Take CNBC’s new online course How to Ace Your Job Interview to learn what hiring managers are really looking for, body language techniques, what to say and not to say, and the best way to talk about pay.
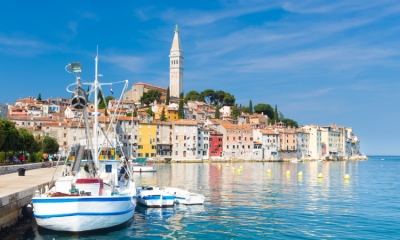
In a recent analysis conducted by the Njuškalo online advertisement website, it has been revealed that house prices across Croatia experienced a continuous upward trajectory throughout 2023. The study showcased a significant surge, with the average asking price for flats soaring by 21%, reaching €3,223 per square metre. House prices experienced an even more substantial increase, rising by 40% to €2,606.
Dubrovnik and Istria Counties: Pinnacles of Property Rates
The coastal regions of Istria, Dubrovnik-Neretva, and Split-Dalmatia emerged as the epicentres of the escalating property market, with these areas commanding the highest prices. In Istria County, the average asking price for a flat reached €3,836 per square metre, and for a house, it was €3,183 per square metre. The Dubrovnik-Neretva County followed closely, with figures at €3,602 and €2,699, respectively. In Split-Dalmatia County, the corresponding prices stood at €3,590 and €2,960.
City-Specific Trends
In the capital city, Zagreb, the average asking price for a flat reached €2,987 per square metre, while for a house, it was €1,795. Rijeka experienced a 26% increase in flat prices, reaching an average of €2,661 per square metre. Split witnessed a 20% surge, with flats commanding an average of €4,061 per square metre. Meanwhile, Osijek saw a 17% rise, with an average asking price of €1,733 per square metre.
Osijek Leads House Price Surge
Osijek, located in the eastern part of the country, recorded the most substantial increase in house prices, jumping by 15% to an average of €963 per square metre.
The findings point towards a dynamic real estate market in Croatia, with certain regions, particularly Dubrovnik-Neretva and Istria, standing out as hotspots for property investments.
With philanthropist and homeless advocate Pope Francis in charge, things are really changing inside the walls of the venerable institution, and the Vatican will never be the same again.
Over the last year the Vatican has been involved with countless fund-raising opportunities that have brought in private corporate dollars as well as income from high-profile celebrities and billionaires.
Last year Pope Francis for the very first time allowed the Sistine Chapel to be rented out for a private corporate event, with the proceeds going to his homeless charities. The Vatican would not reveal how much it was paid for the event, but the ultimate visit arranged by Porsche cost over $10,000 per person. The 40 wealthy guests enjoyed a spectacular dinner and concert in the Sistine Chapel, beneath its famed Michelangelo ceiling. The concert was performed by a choir from the historic Accademia di Santa Cecilia in Rome.
It is believed this is the first time that the chapel, which was built by Pope Sixtus IV starting in 1473, has been leased out to a company for a private event. The Pope now wants to use the Vatican’s treasures to good use for the benefit of the poor. Porsche was required to make a sizeable donation for the use of the Sistine Chapel, with the money then passed onto charity.
But as the fundraising event was revealed, the Vatican announced it would limit the number of visitors allowed inside the chapel to just six million per year, fearing that the frescoes were being damaged by the huge swarms of tourists.
While Pope Francis urges the world to care for the poor, he presides over the world’s most valuable collection of treasures. According to Catholic Church historian Michael Walsh, “If sold, the money could lift millions out of destitution. Pope Paul VI, whom Francis has just beatified, was so conscious of this paradox that he sold the papal tiara – the triple-tiered crown used in his coronation – to raise alms for the poor. It was bought by an American cardinal, and there has never been a papal ‘coronation’ since. But not everything is saleable. Certainly not the Sistine Chapel. The next best thing is to allow its use as a money-making enterprise with the profits going to the poor.”
Celebrities and billionaires have always had the opportunity to score private visits to the Vatican museums. Justin Bieber was reported to have offered over $50,000 on an exclusive private tour. Angelina Jolie met Pope Francis during a private audience at the Vatican this year as the Goodwill Ambassador for the United Nations High Commissioner for Refugees.
Recently Pope Francis startled the old guard by closing portions of the Vatican and welcoming a group of 150 homeless for a VIP private tour including the Pope’s residence in the St. Martha guesthouse. After visiting the Carriage Pavilion, the large group ventured into the Upper Galleries with the Gallery of the Candelabra and the Gallery of Maps – before making a unique visit to the apartment of Pius V and finally the Sistine Chapel itself. They were then treated to a private sit down dinner.
The brainchild of Archbishop Konrad Krajewski, the visit was designed to show the city’s homeless population not just the beauty from outside St. Peter’s Basilica, but also the beauty within, which belongs to everyone, including those who have met misfortune and are living in poverty.
Now word has come that even the most revered Vatican Secret Archives are for sale to very wealthy buyers. Billionaires now have the opportunity to not only visit the Archives but also purchase a one-of-a-kind high quality copy of a transcript on parchment with a very high price tag (over $100,000 per page). But only an elite group of investors know how to get involved in this opportunity.
As an attempt to showcase the Archives, the Vatican invited a journalist for the very first time to visit the inner sanctum. Belgian publisher Paul Van den Heuvel was handpicked to create a $5,000 photo coffee table book on the Secret Archives, which has now become a catalog of sorts for buyers worldwide. The one caveat is that no documents after 1939 were available to view, which for obvious reasons includes the most scandalous periods of time for the Vatican.
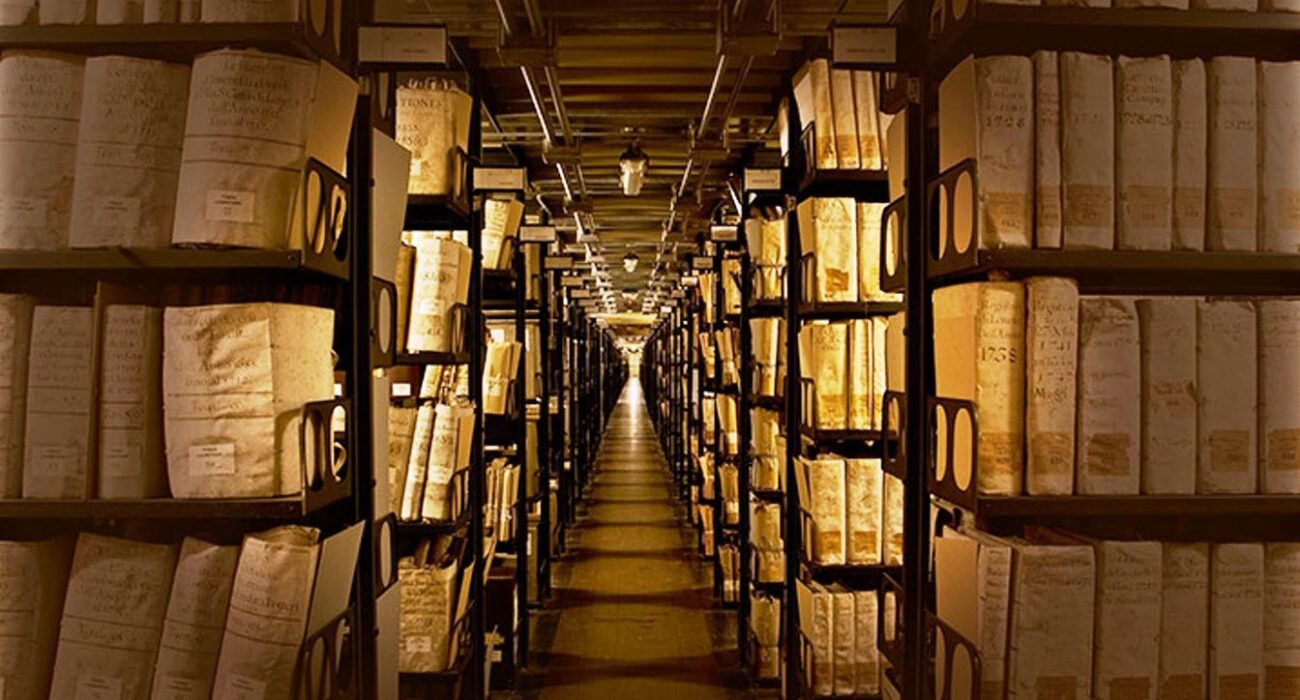
Scholars have been allowed in the archive since 2003, as long as they knew exactly which documents they will research. But now, elite visitors may have the opportunity to have the ultimate in bragging rights. They will be able to walk through an enormous pair of brass doors, through multiple security checkpoints, up a narrow winding staircase to the 73m Tower of the Winds, which was built by Ottavinao Mascherino in 1578. This is a sacred place where the public is never admitted.
Beyond the Tower of Winds are rooms lined with 50 miles (roughly the length of the Panama Canal), filled with dark wooden shelves. Inside are hundreds of thousands of volumes (some almost two feet thick) filled with antiquated parchment. This is the Vatican secret archive, the most mysterious collection of documents in the world.
Among the historic documents are: Handwritten records of Galileo’s trial before the Inquisition; the 1530 petition from England’s House of Lords asking the Pope to annul Henry VIII’s marriage to Catherine of Aragon; letters from Abraham Lincoln and Jefferson Davis during the U.S. Civil War; the papal bull excommunicating Martin Luther, and letters from Michelangelo including one where he complained about not receiving payment for his work on the Sistine Chapel.
Some of the more controversial, and much argued theories about hidden documents include; documentation of the Jesus bloodline; secular historical proof of Jesus’s existence, with correspondence between Saint Paul and Emperor Nero; secular historical proof via the same correspondence that Jesus did not exist; and contemporary depictions of Jesus (formal portraits of Jesus made by people who actually saw and depicted him in real life).
Many historians and scholars have also hinted the Church has hidden the existence of various Biblical relics, either the relics themselves, or reliable documentation as to their whereabouts, including the Ark of the Covenant, the Holy Grail, the True Cross, the truth about the Shroud of Turin, and many others.
Once, Napoleon had the whole of the secret archive transported to Paris. In 1817 it was eventually returned with countless documents missing. Private investors have speculated about what truly is available in the public sector, hidden for decades.
For now, the future of the Vatican is certainly changing forever. Many more opportunities will be unveiled in the coming year with fund raising efforts giving help to a lot of people less fortunate…. thanks to Pope Francis.