
- Average UK property prices increased £1,410 from December to January
- London properties enjoyed biggest rise in with 2.5% or £12,950 added to value
- Month-on-month increase comes despite annual plunge in prices across the UK
A new online calculator can reveal how much your property may could have gained or lost in value over the last year.
This comes as homeowners across Britain can finally see some signs of an upturn in the property market today, analysis by online estate agent Purplebricks reveals.
The biggest winners have been property owners in South Hams, Devon, where prices rose by around £47,500 (11%) in one year.The biggest losers were in Westminster where prices fell by nearly £196,000 (21%).
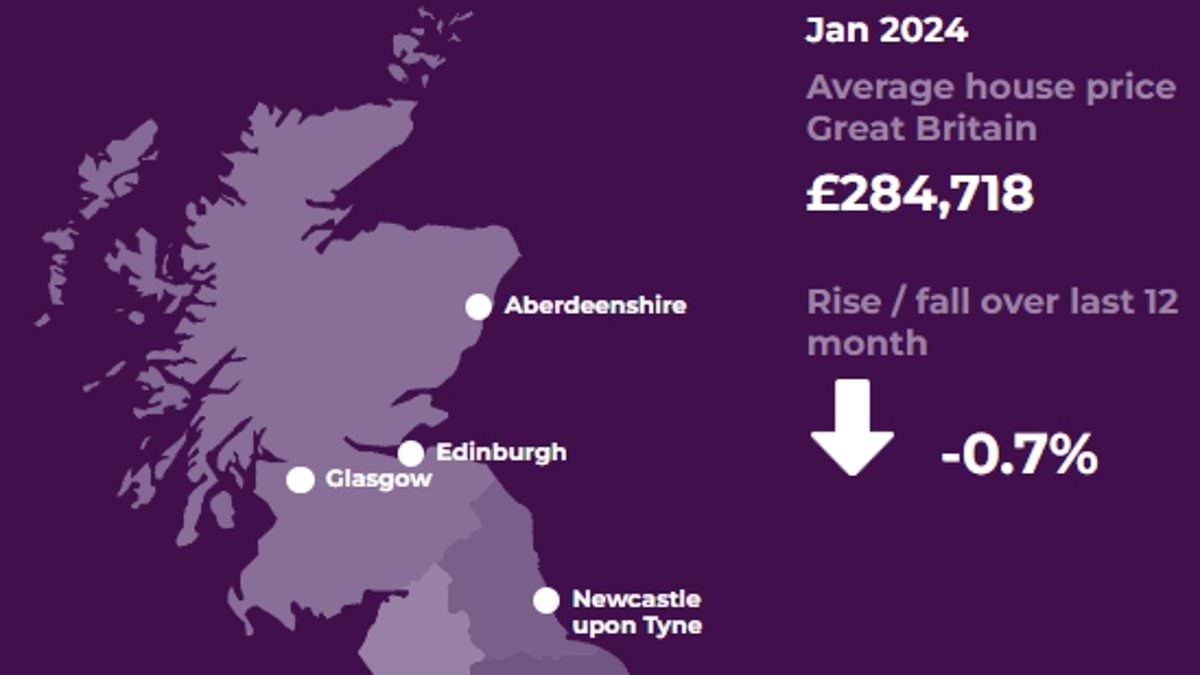
Average UK house prices increased 0.5% or £1,410 from December to January, making the average property now valued at £282,000, according to today’s House Price Index (HPI).
The figures, released today by the Office for National Statistics, will come as welcome news for millions of homeowners. An interactive tool has been updated to include the latest House Price Index data, released by the Office for National Statistics today.
To use the Purplebricks calculator, simply search for YOUR local area below and find out how house prices have changed over the last 12 months:
The new figures follow a miniscule rise of just £300 in the value of average UK properties from November to December last year.
London homes saw the biggest month-on-month rise, with around £2.5% or £12,950 added to the average property in the capital, now valued at £518,000.
However, the annual price change paints a very different picture, with another 3.9% drop in values in the capital, felt most sharply in the City of Westminster.
Homes in the exclusive City of Westminster lost a staggering £195,000 over the last year, with properties in the City of London shedding just over £160,000 of their value.
Kensington and Chelsea properties lost around £147,000, Hammersmith and Fulham lost nearly £80,000 and Camden properties just over £50,000 in the 12 months to January.
Average annual property prices in both England and Wales fell, with a typical house in England falling 1.5% in value to £299,000, and dropping 0.8% to £213,000 in Wales.
The North West of England was the best performing UK region, where house prices rose one per cent in the 12 months to January.
Properties in South Hams, Devon, saw the biggest increase in value, with homes rising just over £47,000 or 11% over 12 months.
Winchester homes increased more than £36,000, with East Cambridgeshire properties enjoying a boost of more than £32,000.
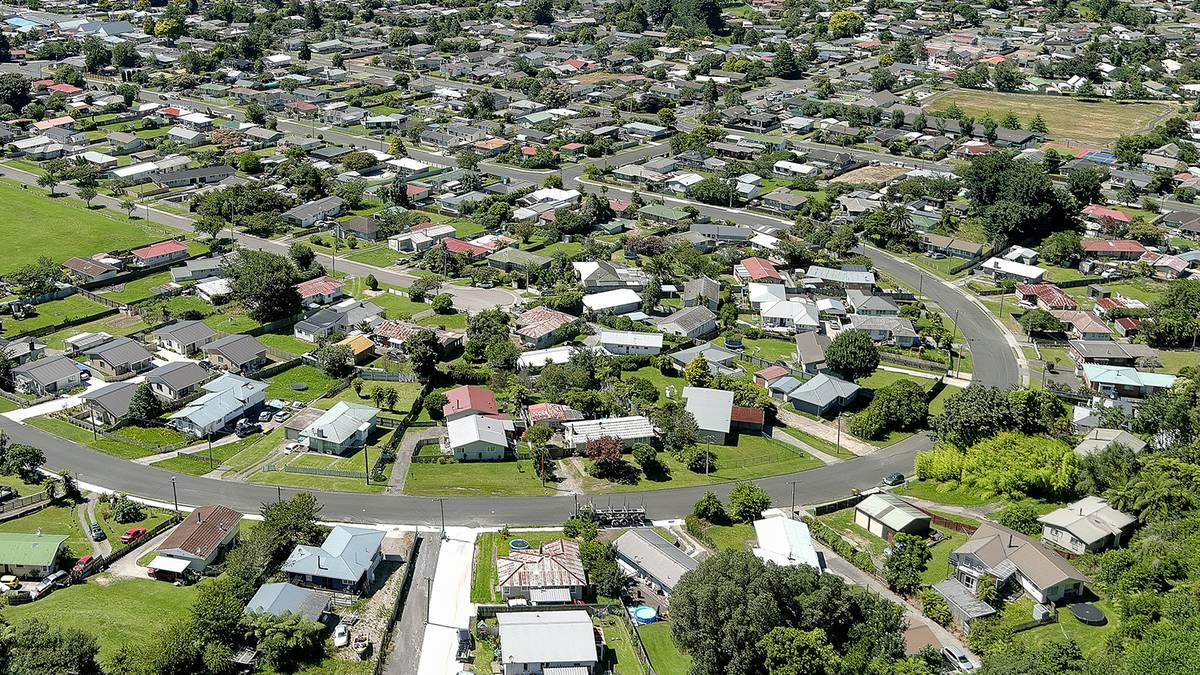
The average price of a house in Rotorua has risen to $746,000 after the city’s average residential property values increased by 0.4 per cent in three months.
According to the latest data from the OneRoof Valocity House Value Index, taken at the end of January, property values across the country are up by 0.9 per cent compared to three months ago.
OneRoof’s latest House Price Report showed property values were up quarter-on-quarter in 90 per cent of suburbs nationwide, with the biggest quarterly lifts in Arrowtown, Mataura and Whitford.
Of the 793 suburbs with 20-plus settled sales in the last 12 months, more than 40 per cent saw year-on-year value lifts, reflecting the turnaround in the market.
AdvertisementAdvertise with NZME.
Rotorua suburbs with more than 20 settled sales in the year ending January 31 included Hamurana, where property values increased by 2.1 per cent in the last three months to $1.23 million.
Western Heights saw the second-highest three-month increase in suburb property value, a difference of 2 per cent.
Rotorua Professionals McDowell Real Estate principal and auctioneer Steve Lovegrove said the post-summer, early autumn season was normally a busy one for real estate.
“The good news for everybody is that prices seem to be mostly stable, certainly not going backwards and probably increasing,” Lovegrove told the Rotorua Daily Post.
AdvertisementAdvertise with NZME.
“We are starting to see the green shoots of property price increases.”
Lovegrove said there was also a lift in the stock available.
“So buyers do have a little more choice and less need to act urgently. We’re seeing a little bit of lag in decision-making and a significant lift in buyers actively entering the marketplace.”
Lovegrove said there was more competition for properties in the $500,000 to $700,000 value range.
“Anything just below that average price is getting hit quite hard with active buyers, mostly first-home buyers.”
Lovegrove said there was also a trend of people looking to downsize which also saw more buyers looking in the lower price ranges.
“There’s a lot of confidence, a positive vibe and a positive outlook looking forward. We’re not expecting a rapid price increase. We are expecting simply more confidence.”

Tremains central region general manager Stuart Christensen said there was more property coming onto the market.
“More people have decided to make a move. Westpac dropped their interest rates on Friday. All those are encouraging signs,” Christensen said.
“We are seeing an increasing number of people at our open homes. So there’s appetite to come out and a good number of first-home buyers are out there.”
AdvertisementAdvertise with NZME.
Christensen said first-home buyers did have a window to make their decisions, however, as investors were coming gradually back into the market as well.
“Overall there’s a lot more positivity. It’s a new year. People are out looking for a move whether they are upsizing, downsizing or entering the market for the first time.”

The news comes after New Zealand’s average property value grew just 0.9 per cent in the three months to the end of November to $973,000, as buyers retreated from the market after a busy November and October.
Valocity global chief executive of real estate Helen O’Sullivan said sales volumes in December were lower than had been anticipated, given the lift in October and November, although they were up year-on-year.
Valocity data showed mortgages registered to first-home buyers in the last quarter of the year dipped to 44 per cent from the five-year high of 45 per cent the previous quarter. Mortgages registered to investors increased slightly from 22.4 per cent to 23.6 per cent over the same period.
O’Sullivan said the Reserve Bank’s announcement around debt-to-income ratios was unlikely to have an impact on the current market.
AdvertisementAdvertise with NZME.
“The proposed settings are not expected to make a significant difference to prices or activity levels in the current high-interest rate environment,” she said.
“When interest rates are lower, [debt-to-income ratios] will limit the level of debt borrowers can assume despite being able to service the debt.”
Maryana Garcia is a regional reporter writing for the Rotorua Daily Post and the Bay of Plenty Times. She covers local issues, health and crime.
- Homes in London saw average of £53,000 wiped from values in last 12 months
- Nine London boroughs lose value – with Kensington and Chelsea worst hit
A new interactive map shows how London homeowners have seen property values tumble, with an average of £53,000 wiped off the value of their properties in the last 12 months.
Nine London boroughs were hammered by price plunges, with Kensington and Chelsea being the hardest hit area, shedding an eye-watering £154,000 in 12 months, according to House Price Index (HPI) data and analysis by online estate agent Purplebricks.
But it wasn’t all bad news for people living in and around the capital, with properties in the London borough of Richmond upon Thames increasing £22,730 in value, and homeowners in the Surrey district of Mole Valley seeing a rise of £46,089.
Other homeowners just outside the capital have little to celebrate too, with homes in nine commuter belt areas losing an average of £35,000 in the space of a year.
In total, 18 of the top 20 worst-hit areas were either in the capital itself or a borough or district surrounding it – the average loss among them being £53,000.
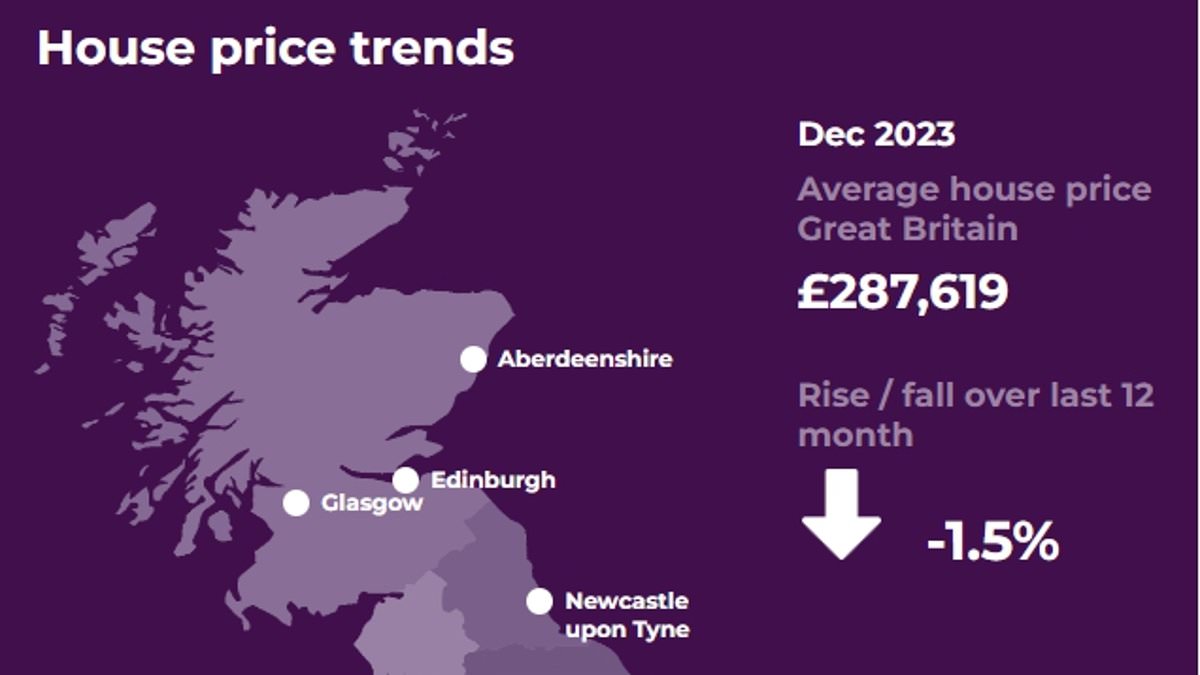
The stark figures from the Office for National Statistics reveal average UK house prices fell by £4,000 or 1.4% in the 12 months to December, making a typical house worth £285,000.
Search for YOUR local area in this widget from Purplebricks below, and find out how house prices have changed over the last 12 months.
Click here to resize this module
The fall in prices is a slight improvement on the drop of 2.3% for the 12 months up to November.
Average property prices in both England and Wales fell, with a typical house in England falling 2.1% in value to £302,000, and dropping 2.5% to £214,000 in Wales.
The North East of England saw the biggest price change with an increase of 1.2%, while overall London was hit the hardest with a 4.8% slump.
However, homes in Scotland are now worth an average of £190,000 after enjoying a 3.3% rise in the last year.
And, average properties rose 1.4% to £178,000 in Northern Ireland in the year to Quarter 4, from October to December 20223.
In the capital, the City of London and Westminster lost around £142,000 and £141,000 respectively, while Hammersmith and Fulham properties dropped £70,000, Waltham Forest homes lost £42,000 and Haringey shed £28,000.
Outside London, the leafy stockbroker belt town of Tunbridge Wells took a bruising, with the average home losing around £47,000.
Homes in popular commuter areas like Runnymeade, Surrey Heath, Welwyn Hatfield, Tonbridge and Malling and St Albans lost an average of £37,000 in the last 12 months.
Sam Mitchell, CEO of Purplebricks said: ‘While these figures may appear quite striking, there is plenty of good news for homeowners, and plenty more on the horizon.
‘Homeowners in Scotland and Northern Ireland are continuing to see increases, and evidently the rate of decline is slowing across the UK in general.
‘As long as we continue to see inflation moving in the right direction so the mortgage markets continue to move, I predict this trend will continue, and by the end of the year average UK prices will be back on the increase – and that, of course, includes the capital.’