
It would take a multifamily buyer roughly 26 years to make their money back on a property acquisition in San Francisco at today’s pricing. In Fort Lauderdale, Florida, the breakeven time shrinks to 16 years.
There’s a more than 200-basis-point gap in capitalization rates across the 30 most active multifamily markets in the U.S. The city-to-city differences offer a unique insight into how investors are measuring risk against reward in both mainstay primary multifamily markets and the pandemic-era darlings.
Cap rates are a simple calculation — a property’s net operating income, or its profits before accounting for debt service and taxes, divided by its sale price — that packs in nearly limitless nuance.
High cap rates mean a quicker return on investment, but they also frequently signal riskier deals. More buyers bidding on properties can drive up property prices and drive down cap rates, and shifting yields on 10-year Treasury bonds drag cap rates along with them.
Generally, cap rates are lower when markets are performing better as a result of more lucrative rent collection and higher property values.
The 30 most active multifamily markets tallied 929 deals through September totaling $41B, with an average cap rate of 5.04%, according to data provided to Bisnow by Yardi Matrix.
U.S. apartment cap rates bottomed out at 4.1% in 2021 after a decadelong decline and climbed back to 5.2% by 2023 but sat stagnant in 2024.
Cap rates declined modestly in the first half of 2025, according to the data from Yardi and research from CBRE. A majority of respondents to the brokerage’s U.S. cap rates survey released in August said that they expected multifamily cap rates would stay flat through the end of the year. The number expecting a further decline outpaces those who expect cap rates to go up.

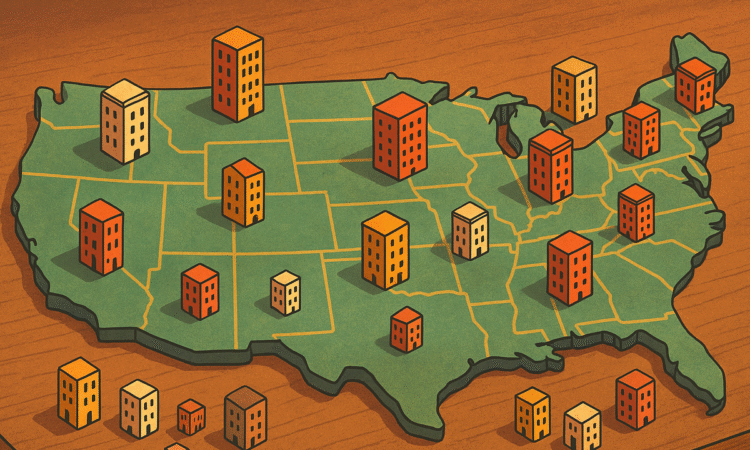
Bisnow/created with assistance from ChatGPT
Phoenix leads the country with $3.3B in multifamily sales through September.
Yardi doesn’t have standardized market definitions, leaving some areas broken down into submarkets while others encompass much larger swaths.
That pits entire regions like Washington, D.C., and suburban Maryland against pieces of a city, like Manhattan, West Houston, suburban Atlanta or one of three parts of the Bay Area, all of which rank somewhere in the top 30.
The San Francisco Peninsula, the piece of the city with the highest concentration of tech companies and affluent residents, boasts the lowest cap rate across the 30 most active U.S. markets, at 3.88%. The Fort Lauderdale area is the highest, at 6.27%.
Multifamily investment volume is up modestly from last year, according to Avison Young, despite tariff uncertainty, still-high inflation and debt costs, a weakening job market and little in the way of relief on capital costs.
“Maybe we’re in the 26th inning of that uncertainty,” said Anthony DeMarco, who focuses on investment sales at the Cleveland office of debt brokerage BWE. “We’re in extra innings, that’s probably the best way to put it, but what you’re starting to see is an uptick in transactional volume.”
Private investors have accounted for just over half of buyers this year, and institutional investors have maintained a steady presence in the multifamily market, according to Avison Young. But REITs doubled their buying power in the last two years, accounting for 6% of purchases in the first half of 2025, up from 3% in 2023.
As for who’s selling, DeMarco said it is less about wanting to bring an asset to market than having to find a buyer. The pool of opportunistic sellers is more of a puddle, and the properties that are meeting the market on price tend to be facing some type of hurdle, whether it’s stabilization, a loan maturity or the rare default.
“The sellers that are on the market, there is a specific reason that they’re selling, and that doesn’t always mean distress,” he said.


