
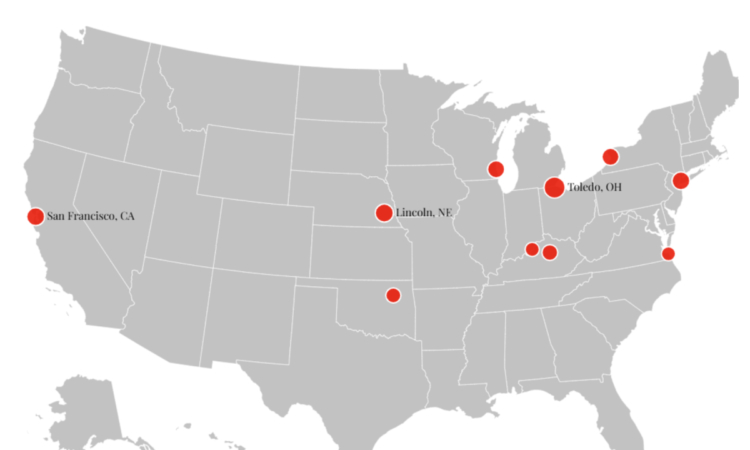
House prices in the U.S. increased the most in Toledo, Ohio; Lincoln, Nebraska; and San Francisco, California, between 2025 and 2026, according to a new study by financial advice platform SmartAsset.
On the flip side, researchers found that house prices decreased the most in Oakland, California; St. Petersburg, Florida; and Naples, Florida.
Newsweek has created a map showing the top 10 cities where home prices increased the most in the last year.

Why It Matters
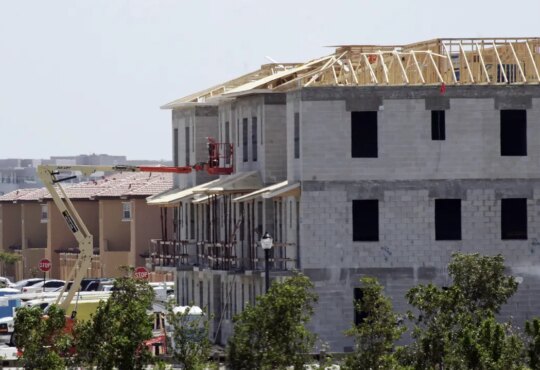
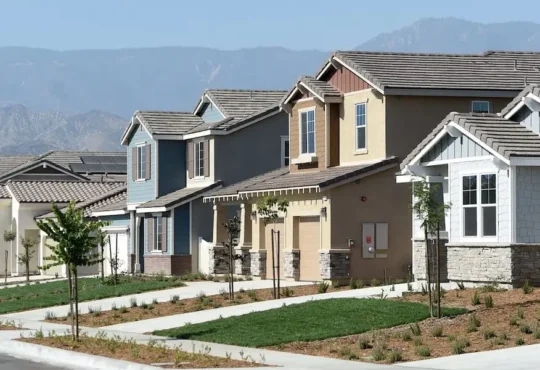
Homeownership and the price of property has emerged as a key issue in the U.S., with many people struggling to get on the housing ladder. The average age of first-time homebuyers reached an all-time high of 40, according to a recent report by the National Association of Realtors and the U.S. housing market slowed last year because of high home prices, elevated borrowing costs and other factors.
The new data may influence where prospective buyers choose to search for property, while those hoping to sell their homes may benefit from the increased value of their assets or struggle to sell expensive housing stock amid a sluggish economy.
What To Know
SmartAsset ranked 100 of the largest U.S. cities based on a one-year change in their typical home value. The platform found that the city where house prices increased the most was Toledo, where property prices increased 5.6 percent in a year.
In second place was Lincoln, Nebraska, where SmartAsset recorded a 4.11 percent annual change. San Francisco was next with a 4.04 percent change and New York City followed with a 3.97 percent increase.
Overall, SmartAsset found that the typical home value in large U.S. cities dropped 1.04 percent.
Conversely, the cities where home values decreased the most were Oakland (-9.07 percent), St. Petersburg, Florida (-7.47 percent) and Naples, Florida (-6.35 percent).
This year, national home values are projected to rise about 0.7 percent by the end of 2026, while existing home sales are expected to increase roughly 4.4 percent compared with the prior year, according to Zillow’s latest Home Value and Home Sales Forecast.
Meanwhile, there were nearly 630,000 more sellers than buyers in the U.S. housing market in February, the largest gap dating to 2013, according to data provided by housing information and listing service Redfin.
And according to ATTOM, a provider of property data and real estate analytics, a buyer in the first quarter of 2026 would have had to earn $84,230 per year to afford a nationally medium-priced home and keep major monthly expenses below the 28 percent of wages threshold, which is considered affordable.
What People Are Saying
Rob Barber, the CEO of ATTOM, in a previous statement: “Over the last several years, wages haven’t kept up with rising home prices in many markets. Mortgage rates dropped throughout last year, which offset some of that growing affordability gap, but shifts in the broader economic environment can still influence rates and home purchasing power.”
What Happens Next
The price of property in various cities in the U.S. will likely fluctuate in line with different economic factors at the local and national levels.


