
PHOENIX (AZFamily) — Gov. Katie Hobbs and other Phoenix-area leaders celebrated the grand opening of new affordable housing units in Phoenix.
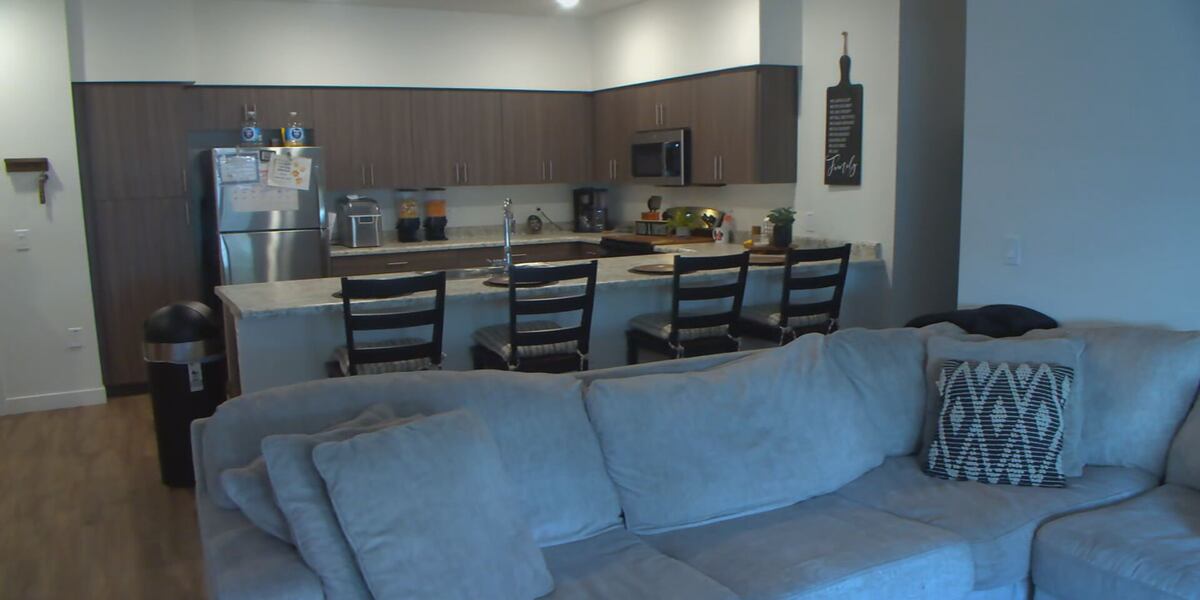
The first phase of the complex, just off 31st Avenue and Thunderbird Road, features several parks, splash pads, and 108 three- and four-bedroom apartments.
“This is really amazing. I spent my career working in domestic violence so affordable housing is a big piece of how we address that. This is an amazing project that’s going to make lives better for a lot of Arizonans,” Hobbs said.
These new homes will serve as mixed-income and permanent supportive housing developments for families in need. Right now, the city of Phoenix reports that nearly 46% of its residents are considered low or extremely low-income, which means a lot of families are struggling to make ends meet.
“Affordable housing is essential. It’s everything. If you don’t have a safe place where you can call home, a place to breathe, take stock, and be able to think of how you can plan for your life and your family’s life there’s not much else you can do,” said Jessica Raymond, the executive vice president for Atlantic Development and Investments.
A mom of three, Elizabeth Galbez, said these homes are a path to help get them back on their feet toward success.
“There is something horrible about not being able to provide for your family. It destroys your self-esteem. It destroys your self-worth. As a mom, as a woman, as the primary breadwinner, it was like taking away who I was. So being here has given me back me,” Galbez said.
Atlantic Development and Investments reports that the local economic benefits of the project include $7.9 million in local income and 131 jobs.
Sources of funding for the project include housing trust funds and tax credit equity generated by an allocation of low-income housing tax credits from the Arizona Department of Housing, $1 million in HOME funds from the city of Phoenix, $1 million in AHCCCS Housing Trust Funds and GAP financing provided by the developer.
For more information on the Reserve at Thunderbird, click/tap here.
See a spelling or grammatical error in our story? Please click here to report it.
Do you have a photo or video of a breaking news story? Send it to us here with a brief description.
Copyright 2024 KTVK/KPHO. All rights reserved.
PHOENIX (3TV/CBS 5) — The real estate frenzy spurred by the coronavirus pandemic continues, though at a slower pace. Buyers are still competing for a limited supply of housing, driving up prices for affordable properties.
The typical home value in the United States was $344,159 in January, 3.6% higher than the year before.
Increasing mortgage rates have slowed growth, with prices even declining in some places. But some areas are still seeing price jumps compared to the year before.
Stacker compiled a list of cities with the fastest-growing home prices in Arizona using data from Zillow. Cities are ranked by the dollar change in the Zillow Home Values Index for all homes from the 12 months ending January 2024. The charts in this story were created automatically using Matplotlib. Data was available for 50 cities and towns in Arizona.
#50. Oro Valley
– Typical home value: $499,667
– 1-year price change: +$9,633 (+2.0%)
– 5-year price change: +$178,199 (+55.4%)
– Metro area: Tucson, AZ
#49. Tonopah
– Typical home value: $376,859
– 1-year price change: +$9,673 (+2.6%)
– 5-year price change: +$165,619 (+78.4%)
– Metro area: Phoenix-Mesa-Chandler, AZ
#48. Rio Rico
– Typical home value: $253,168
– 1-year price change: +$10,054 (+4.1%)
– 5-year price change: +$108,271 (+74.7%)
– Metro area: Nogales, AZ
#47. Eagar
– Typical home value: $281,261
– 1-year price change: +$10,194 (+3.8%)
– 5-year price change: +$114,067 (+68.2%)
– Metro area: not in a metro area
#46. Sedona
– Typical home value: $918,780
– 1-year price change: +$10,253 (+1.1%)
– 5-year price change: +$392,876 (+74.7%)
– Metro area: Prescott Valley-Prescott, AZ
#45. Lakeside
– Typical home value: $390,408
– 1-year price change: +$10,305 (+2.7%)
– 5-year price change: +$164,031 (+72.5%)
– Metro area: Show Low, AZ
#44. Gilbert
– Typical home value: $565,644
– 1-year price change: +$10,441 (+1.9%)
– 5-year price change: +$224,180 (+65.7%)
– Metro area: Phoenix-Mesa-Chandler, AZ
#43. Gadsden
– Typical home value: $239,614
– 1-year price change: +$10,507 (+4.6%)
– 5-year price change: +$103,875 (+76.5%)
– Metro area: Yuma, AZ
#42. Amado
– Typical home value: $239,390
– 1-year price change: +$10,881 (+4.8%)
– 5-year price change: +$99,597 (+71.2%)
– Metro area: Tucson, AZ
#41. Show Low
– Typical home value: $423,245
– 1-year price change: +$10,890 (+2.6%)
– 5-year price change: +$184,516 (+77.3%)
– Metro area: Show Low, AZ
#40. Three Points
– Typical home value: $262,239
– 1-year price change: +$10,897 (+4.3%)
– 5-year price change: +$94,881 (+56.7%)
– Metro area: Tucson, AZ
#39. Bisbee
– Typical home value: $213,825
– 1-year price change: +$11,000 (+5.4%)
– 5-year price change: +$88,146 (+70.1%)
– Metro area: Sierra Vista-Douglas, AZ
#38. San Luis
– Typical home value: $233,658
– 1-year price change: +$11,658 (+5.3%)
– 5-year price change: +$96,432 (+70.3%)
– Metro area: Yuma, AZ
#37. Cornville
– Typical home value: $504,831
– 1-year price change: +$11,744 (+2.4%)
– 5-year price change: +$182,835 (+56.8%)
– Metro area: Prescott Valley-Prescott, AZ
#36. Tempe
– Typical home value: $470,831
– 1-year price change: +$12,403 (+2.7%)
– 5-year price change: +$181,310 (+62.6%)
– Metro area: Phoenix-Mesa-Chandler, AZ
#35. Prescott
– Typical home value: $590,623
– 1-year price change: +$12,871 (+2.2%)
– 5-year price change: +$212,460 (+56.2%)
– Metro area: Prescott Valley-Prescott, AZ
#34. Queen Creek
– Typical home value: $642,435
– 1-year price change: +$13,008 (+2.1%)
– 5-year price change: +$266,320 (+70.8%)
– Metro area: Phoenix-Mesa-Chandler, AZ
#33. Payson
– Typical home value: $437,210
– 1-year price change: +$13,227 (+3.1%)
– 5-year price change: +$169,122 (+63.1%)
– Metro area: Payson, AZ
#32. Tolleson
– Typical home value: $391,006
– 1-year price change: +$13,310 (+3.5%)
– 5-year price change: +$174,719 (+80.8%)
– Metro area: Phoenix-Mesa-Chandler, AZ
#31. Vernon
– Typical home value: $285,161
– 1-year price change: +$13,647 (+5.0%)
– 5-year price change: +$121,659 (+74.4%)
– Metro area: not in a metro area
#30. Fountain Hills
– Typical home value: $632,886
– 1-year price change: +$14,153 (+2.3%)
– 5-year price change: +$235,200 (+59.1%)
– Metro area: Phoenix-Mesa-Chandler, AZ
#29. Patagonia
– Typical home value: $401,086
– 1-year price change: +$14,863 (+3.8%)
– 5-year price change: +$160,407 (+66.6%)
– Metro area: Nogales, AZ
#28. Parker
– Typical home value: $378,417
– 1-year price change: +$14,891 (+4.1%)
– 5-year price change: +$155,271 (+69.6%)
– Metro area: not in a metro area
#27. Concho
– Typical home value: $256,254
– 1-year price change: +$15,152 (+6.3%)
– 5-year price change: +$107,117 (+71.8%)
– Metro area: not in a metro area
#26. Wickenburg
– Typical home value: $524,995
– 1-year price change: +$15,173 (+3.0%)
– 5-year price change: +$207,100 (+65.1%)
– Metro area: Phoenix-Mesa-Chandler, AZ
#25. Waddell
– Typical home value: $536,820
– 1-year price change: +$15,408 (+3.0%)
– 5-year price change: +$217,398 (+68.1%)
– Metro area: Phoenix-Mesa-Chandler, AZ
#24. Pine
– Typical home value: $470,960
– 1-year price change: +$15,584 (+3.4%)
– 5-year price change: +$212,122 (+82.0%)
– Metro area: Payson, AZ
#23. Cottonwood
– Typical home value: $386,820
– 1-year price change: +$16,502 (+4.5%)
– 5-year price change: +$151,439 (+64.3%)
– Metro area: Prescott Valley-Prescott, AZ
#22. Williams
– Typical home value: $405,231
– 1-year price change: +$16,781 (+4.3%)
– 5-year price change: +$169,775 (+72.1%)
– Metro area: Flagstaff, AZ
#21. Catalina
– Typical home value: $409,142
– 1-year price change: +$17,532 (+4.5%)
– 5-year price change: +$162,660 (+66.0%)
– Metro area: Tucson, AZ
#20. Rio Verde
– Typical home value: $813,943
– 1-year price change: +$18,194 (+2.3%)
– 5-year price change: +$315,413 (+63.3%)
– Metro area: Phoenix-Mesa-Chandler, AZ
#19. Clarkdale
– Typical home value: $456,959
– 1-year price change: +$18,448 (+4.2%)
– 5-year price change: +$172,751 (+60.8%)
– Metro area: Prescott Valley-Prescott, AZ
#18. Mormon Lake
– Typical home value: $324,497
– 1-year price change: +$19,370 (+6.3%)
– 5-year price change: +$149,117 (+85.0%)
– Metro area: Flagstaff, AZ
#17. Parks
– Typical home value: $615,731
– 1-year price change: +$21,696 (+3.7%)
– 5-year price change: +$251,361 (+69.0%)
– Metro area: Flagstaff, AZ
#16. Bellemont
– Typical home value: $446,818
– 1-year price change: +$21,805 (+5.1%)
– 5-year price change: +$179,717 (+67.3%)
– Metro area: Flagstaff, AZ
#15. Tortolita
– Typical home value: $606,372
– 1-year price change: +$21,974 (+3.8%)
– 5-year price change: +$217,139 (+55.8%)
– Metro area: Tucson, AZ
#14. Sonoita
– Typical home value: $539,899
– 1-year price change: +$22,213 (+4.3%)
– 5-year price change: +$202,546 (+60.0%)
– Metro area: Tucson, AZ
#13. Star Valley
– Typical home value: $532,761
– 1-year price change: +$22,481 (+4.4%)
– 5-year price change: +$214,094 (+67.2%)
– Metro area: Payson, AZ
#12. Munds Park
– Typical home value: $572,396
– 1-year price change: +$22,751 (+4.1%)
– 5-year price change: +$268,447 (+88.3%)
– Metro area: Flagstaff, AZ
#11. Forest Lakes
– Typical home value: $503,814
– 1-year price change: +$25,411 (+5.3%)
– 5-year price change: +$233,655 (+86.5%)
– Metro area: Flagstaff, AZ
#10. Flagstaff
– Typical home value: $622,412
– 1-year price change: +$26,413 (+4.4%)
– 5-year price change: +$248,578 (+66.5%)
– Metro area: Flagstaff, AZ
#9. Elgin
– Typical home value: $521,099
– 1-year price change: +$28,383 (+5.8%)
– 5-year price change: +$198,816 (+61.7%)
– Metro area: Nogales, AZ
#8. Scottsdale
– Typical home value: $792,522
– 1-year price change: +$29,168 (+3.8%)
– 5-year price change: +$320,637 (+67.9%)
– Metro area: Phoenix-Mesa-Chandler, AZ
#7. Tubac
– Typical home value: $508,534
– 1-year price change: +$29,528 (+6.2%)
– 5-year price change: +$198,354 (+63.9%)
– Metro area: Nogales, AZ
#6. New River
– Typical home value: $722,347
– 1-year price change: +$33,701 (+4.9%)
– 5-year price change: +$291,775 (+67.8%)
– Metro area: Phoenix-Mesa-Chandler, AZ
#5. Happy Jack
– Typical home value: $484,527
– 1-year price change: +$40,243 (+9.1%)
– 5-year price change: +$230,053 (+90.4%)
– Metro area: Flagstaff, AZ
#4. Fort McDowell
– Typical home value: $1,039,123
– 1-year price change: +$40,731 (+4.1%)
– 5-year price change: +$377,731 (+57.1%)
– Metro area: Phoenix-Mesa-Chandler, AZ
#3. Carefree
– Typical home value: $1,219,524
– 1-year price change: +$50,878 (+4.4%)
– 5-year price change: +$506,962 (+71.1%)
– Metro area: Phoenix-Mesa-Chandler, AZ
#2. Cave Creek
– Typical home value: $989,246
– 1-year price change: +$67,758 (+7.4%)
– 5-year price change: +$424,981 (+75.3%)
– Metro area: Phoenix-Mesa-Chandler, AZ
#1. Paradise Valley
– Typical home value: $3,270,191
– 1-year price change: +$136,225 (+4.3%)
– 5-year price change: +$1,440,934 (+78.8%)
– Metro area: Phoenix-Mesa-Chandler, AZ
This story features data reporting and writing by Elena Cox and is part of a series utilizing data automation across 50 states.
Copyright 2024 KTVK/KPHO. All rights reserved.