

17 housing trends that defined the year, including record home prices and sky-high mortgage rates
The 2022 housing market was nothing short of remarkable. The pandemic and resulting remote work continued to define how, when, and where people bought homes. The median U.S. home price hit a record high before falling slightly. Rising rents stretched renters’ budgets. High inflation put increased pressure on almost everyone. For the first time in history, mortgage rates doubled in the span of just one year. The list goes on.
In general, 2022 was a reaction to the dramatic real estate boom in 2021. The year started with a surge in prices and growth across the board before falling alongside record inflation in the fall. November and December saw a much slower and seasonally-expected housing market, with year-over-year changes in rent prices, house prices, and interest rates either falling or slowing down.
Below is a non-exhaustive list of data points and visuals that defined the 2022 housing market.
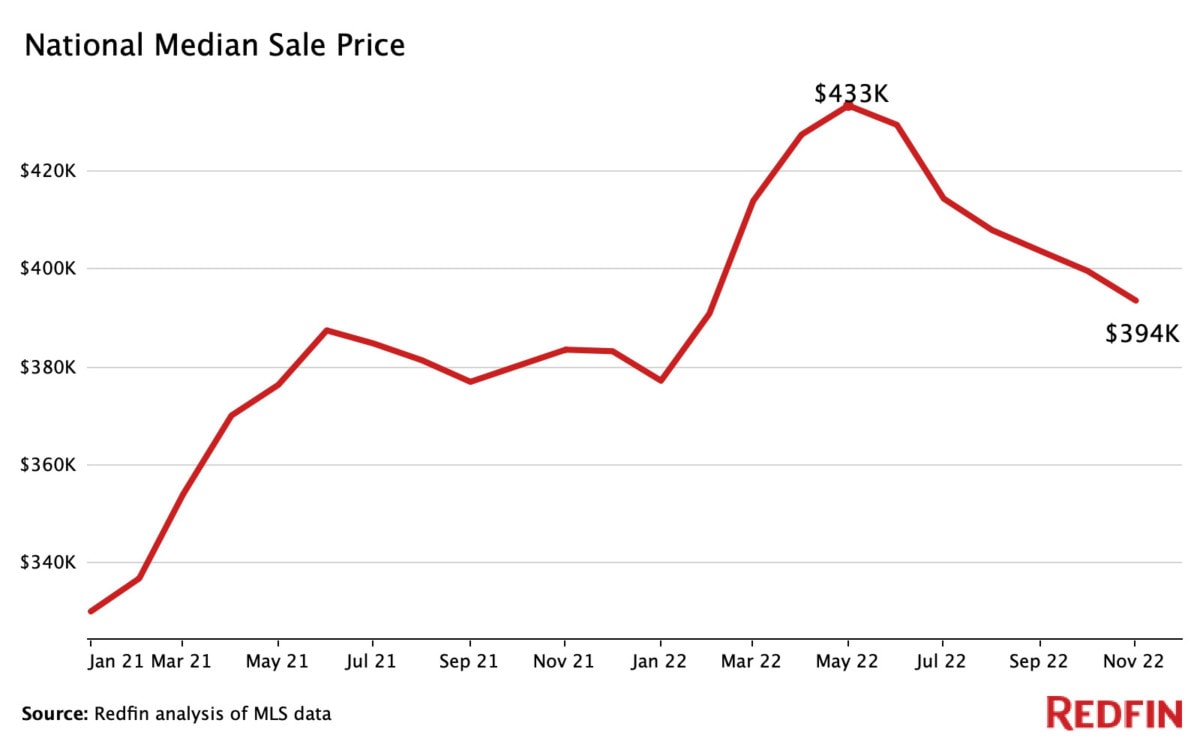
1. Home prices rose to an all-time high
In May, the typical home sold for $430,365, a record high since records began in 1963, shattering 2021’s high of $386,000. In March, the median sale price rose 16.8% year over year, the largest percentage increase over the last five years. Following the pandemic, demand skyrocketed while supply remained historically low, causing a severe housing shortage and price boom that continued throughout 2021 and peaked midway through 2022. In April and May, mortgage rates rose to combat rising inflation, which began reversing housing trends from earlier in the year.
Despite a quickly cooling housing market, prices are still higher today than any previous year on record.
2. San Francisco was the most expensive metro area for homebuyers in 2022
The median sale price of a home in San Francisco was $1,505,000 in 2022, up 0.3% year over year. For one week in April, the median price reached a high of $1,700,000, just below 2021’s all-time high of $1,728,000. As the year went on, prices dropped closer to pre-pandemic levels, which will likely continue until mortgage rates fall further.
- Six of the top ten most expensive metros were in California.
- Many Florida metros experienced the largest year-over-year price growth, including Tampa (18%), Orlando (14.9%), Jacksonville (14.7%), and Miami (14.2%).
- Tampa had the largest year-over-year price growth of all large metros in the country.
The top ten most expensive cities to buy a home in 2022
City |
Median sale price |
Year-over-year change |
| $1,505,000 |
+0.3% |
|
| $1,435,000 |
+7.2% |
|
| $970,000 |
+10.4% |
|
| $939,000 |
+4.2% |
|
| $850,000 |
+7.0% |
|
| San Diego, CA | $815,000 |
+10.3% |
| $777,000 |
+9.3% |
|
| $683,000 |
+5.5% |
|
| $650,000 |
+7.7% |
|
| $600,000 |
+5.8% |
Data includes the yearly aggregated median sale prices out of all homes sold in each of the 50 largest metropolitan areas. Data does not take into account local median incomes and home affordability.
3. Detroit was the least expensive metro area for homebuyers in 2022
The median sale price for a home in Detroit was $165,000 in 2022, up 3.3% year over year. Home prices in Detroit hit $213,000 for a week in June, making it the most expensive month of the year but still nearly 50% lower than the national median. In general, year-over-year price increases in 2022 were smaller across most major metros than in 2021, and growth dipped further heading into the first week of December.
- The top ten least expensive metros were all located in the Rust Belt, a geographic region near the Great Lakes.
- Philadelphia was the only large metro that experienced a price decrease in 2022.
- Kansas City, MO was the eleventh least expensive metro, and the first non-Rust-Belt metro on the list.
The top ten least expensive cities to buy a home in 2022
City |
Median sale price |
Year-over-year change |
| $165,000 |
+3.3% |
|
| $185,000 |
+5.4% |
|
| $205,000 |
+2.4% |
|
| $235,000 |
+9.6% |
|
| $239,000 |
+7.7% |
|
| $249,900 |
-0.01% |
|
| $260,000 |
+4.8% |
|
| $262,000 |
+4.5% |
|
| $275,000 |
+11.6% |
|
| $290,000 |
+10.3% |
Data includes the yearly aggregated median sale prices out of all homes sold in each of the 50 largest metropolitan areas. Data does not take into account local median incomes and home affordability.
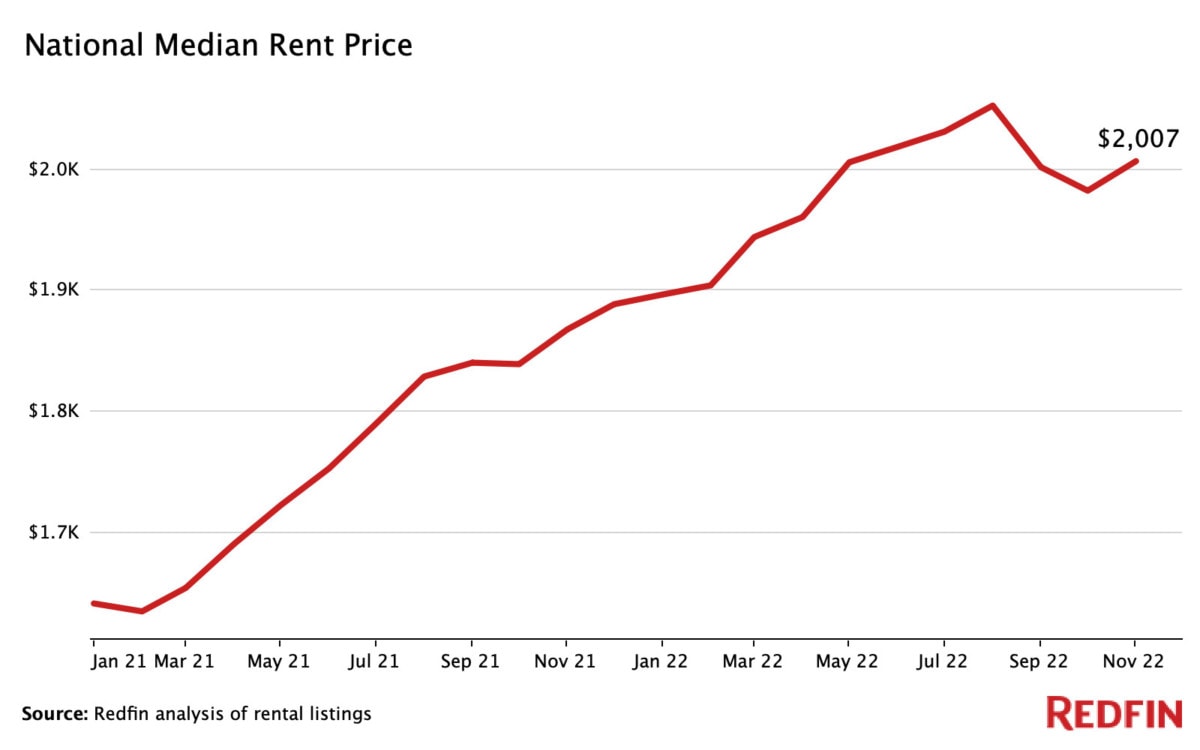
4. Rent prices rose dramatically as supply struggled to keep up with demand
Rent prices in 2022 were 12.8% higher than they were in 2021. Nationwide, the median rent price rose to $2,053 in August before dipping slightly, the highest on record and a 12.3% increase year-over-year. Following the pandemic, rent prices skyrocketed largely because of a lack of supply and a boom in demand, both of which are just now balancing out.
- Median rent prices in New York rose to over $4,000, retaining its dominance as the most expensive metro for renters in the country.
- Many of the least expensive metros experienced the highest year-over-year rent increases, including Oklahoma City (23.3%), Cincinnati (17.6%), and Pittsburgh (14.8%).
- Oklahoma City experienced the highest year-over-year rent increases in the country.
- Rent growth has consistently outpaced wages for decades, but the most recent data states that a staggering 40% of renters spent more than 30% of their income on rent from 2017-2021.
There are currently over 1.1 million rental units under construction in the U.S., which will come available for rent over the next year, helping to alleviate part of the housing shortage.
“We expect rents to fall in nearly every part of the country by the middle of 2023 as supply starts overtaking demand,” notes Taylor Marr, Redfin Deputy Chief Economist. “While renters typically get the best deal during the winter months as demand is lower, rents are continuing to ease. Because of this, there won’t be as much of a seasonal increase come spring, and thus patience for a good deal will pay off. And don’t be afraid to negotiate; some landlords may be open to concessions like a free month’s rent or free parking.”
The top ten most expensive cities for renters in 2022
City |
Median rent price |
Year-over-year change |
| $4,043 |
+10.8% |
|
| $3,764 |
+3.1% |
|
| $3,749 |
+7.6% |
|
| $3,558 |
+7.3% |
|
| $3,435 |
+0.8% |
|
| $3,345 |
+8.2% |
|
| $3,098 |
+8.7% |
|
| $2,994 |
+7.0% |
|
| $2,749 |
+6.7% |
|
| $2,700 |
+4.6% |
The top ten least expensive cities for renters in 2022
City |
Median rent price |
Year-over-year change |
| $1,308 | +23.3% | |
| $1,372 |
+13.2% |
|
| $1,442 |
+12.4% |
|
| $1,447 |
+4.7% |
|
| $1,454 |
+13.9% |
|
| $1,456 |
+3.1% |
|
| $1,547 |
+4.8% |
|
| $1,555 |
+9.7% |
|
| $1,571 |
+4.8% |
|
| Memphis, TN | $1,581 |
+9.5% |
Data includes the 2022 aggregated median rent prices for each of the 50 largest metropolitan areas compared to 2021 data from the same period. Data is the median of all 0-3 bedroom rental homes.
5. Homebuyers looking to relocate favored Sun-Belt cities
24.1% of homebuyers looked to move to a different metro during the three months ending in November. This is on par with the record high of 24.2% in the third quarter and up from 19.1% in 2019.
- Homebuyers looked to move to sunny, relatively affordable areas, with Miami, Tampa, Las Vegas, and Phoenix being the most popular destinations.
- Homebuyers looked to move away from expensive coastal metros like San Francisco, Los Angeles, and New York, which topped the list.
- 100% of homes in many popular relocation metros experienced severe drought in the past year, including Phoenix, Las Vegas, and Sacramento.
“Similar to 2021, continued growth in remote work and a desire for housing affordability drove relocation patterns in 2022,” Marr continues. “However, trends in some popular destinations reversed course after they became too popular, competitive, and expensive. Cities like Salt Lake City, Phoenix, Tucson, Dallas, and San Antonio all declined in popularity in 2022.”
Data is the percent of Redfin.com users searching for homes outside their metro. Data is the year median aggregate of multiple three month moving aggregates and does not include September-December. Keep up with the latest migration news here.
6. Inflation rose at a record pace, affecting every facet of the housing market
The prices of goods and services rose to 6.48% year over year in November, the highest percentage since August 1982 and more than double the rate from November 2021. In fact, inflation rates have doubled compared to the previous year in every month since June. Rising prices severely limited consumer spending and slowed nearly every facet of the housing market.
-
- To combat the historic inflation, the Fed raised its target interest rate to 4.5%, the highest in 15 years.
- Skyrocketing interest rates caused mortgage rates to rise and increased fears of a recession, keeping homebuyers out of the housing market.
- Inflation rose the fastest in pandemic boomtowns due partly to the sudden jump in house prices, which is a key contributor to inflation.
Data courtesy of FRED. Data measures core CPI (less food and energy) through November 2022.
7. Mortgage rates ballooned to nearly 7% in response to record inflation
After decades of falling mortgage rates, in 2022, rates climbed to nearly 7% in both October and November, higher than any point since 2002. In fact, from October 2021 to October 2022, mortgage rates doubled in one year for the first time in history.
As the year came to a close, optimistic inflation data helped reduce housing interest rates to below 7%.
- In popular migration metros like Phoenix, Las Vegas, and Austin, higher mortgage rates and expensive home prices hurt buyers the most.
- In Phoenix, for example, as mortgage rates climbed in May and June, only 21.5% of homes were affordable to buyers with a $2,500 monthly mortgage budget – a 28.5% drop from 2021.
High inflation and rising mortgage rates often deter buyers, but if you’re able to afford it, ownership may be the better option. “Homeownership is a long-term investment that can lead to significant net worth gains, even with rates above 6%,” advises Dean Hayes, Area Sales Manager with Bay Equity, a Redfin company. “Mortgage rates will likely go down in the new year, meaning more home buyers will return to the market, creating increased competition and less room for negotiation.”

8. Housing inventory rose after hitting a record low
10.7 million homes were listed for sale through November, up 11.2% compared to the 9.5 million homes listed through November in 2021. In the three months ending November 2022, the number of homes for sale increased by 15% year over year, the biggest increase on record.
As mortgage rates rose alongside inflation, more buyers decided to stay put, allowing inventory to increase. Since December 2019, inventory has declined year over year until it finally rose in June 2022.
“Buyers have more leverage now than they have since 2010,” advises San Francisco Redfin agent Josh Felder. “Even with higher mortgage rates, if you intend to stay put for longer than five years, it’s a great investment. Homes are forecast to still appreciate, even in light of current circumstances. Sellers should understand that the market is still moving. Homes don’t sell in five days, well over list price, anymore.”
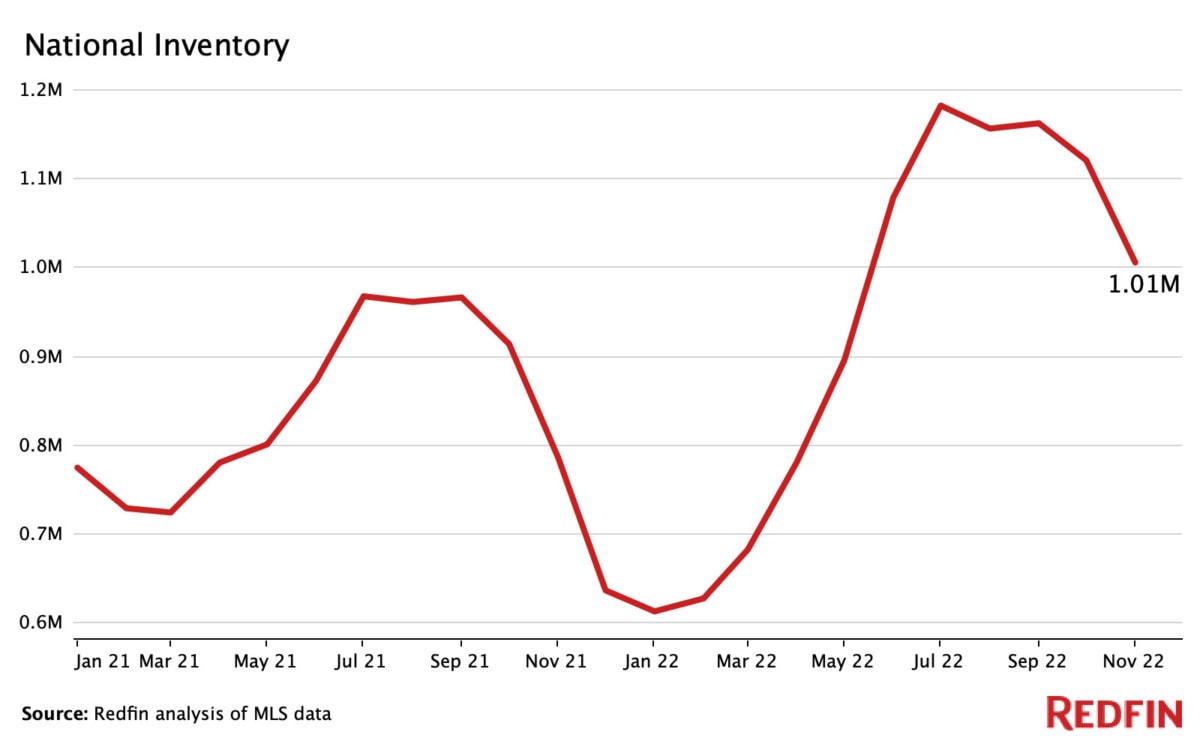
Inventory and supply are calculated in rolling 90-day periods, e.g., January 2022 data is the three-month period from November 1, 2021, through January 31, 2022.
9. Months of supply dropped to a near-record low of just 1.2 months
While inventory measures the number of homes currently available for sale, months of supply measures the amount of time it would take those homes to sell. Four to five months of housing supply is considered the optimal benchmark. Less than three months of housing supply often means that there are more buyers than sellers, while a higher number means there are more sellers than buyers. Inventory and supply typically move together.
Nationwide, months of housing supply dipped to just over 1.2 months in March before slowly rebounding in the summer. Year over year, months of supply has declined almost every month since January 2020.
- As buyers retreated due to high inflation and interest rates, months of supply began to grow in July and August, reaching 2.3 months of supply by September.
- In Seattle, months of supply reached a near-record low of just 15.5 days in January and February, the lowest of any major metropolitan area.
“We are quickly working back toward a balanced market, which is three to six months of inventory,” says Seattle-area Redfin agent Brian Shields. “We’ve been in a seller’s market with less than five months of inventory for several years, until midway through this year. Buyers now have a lot more choices than they did last Spring.”
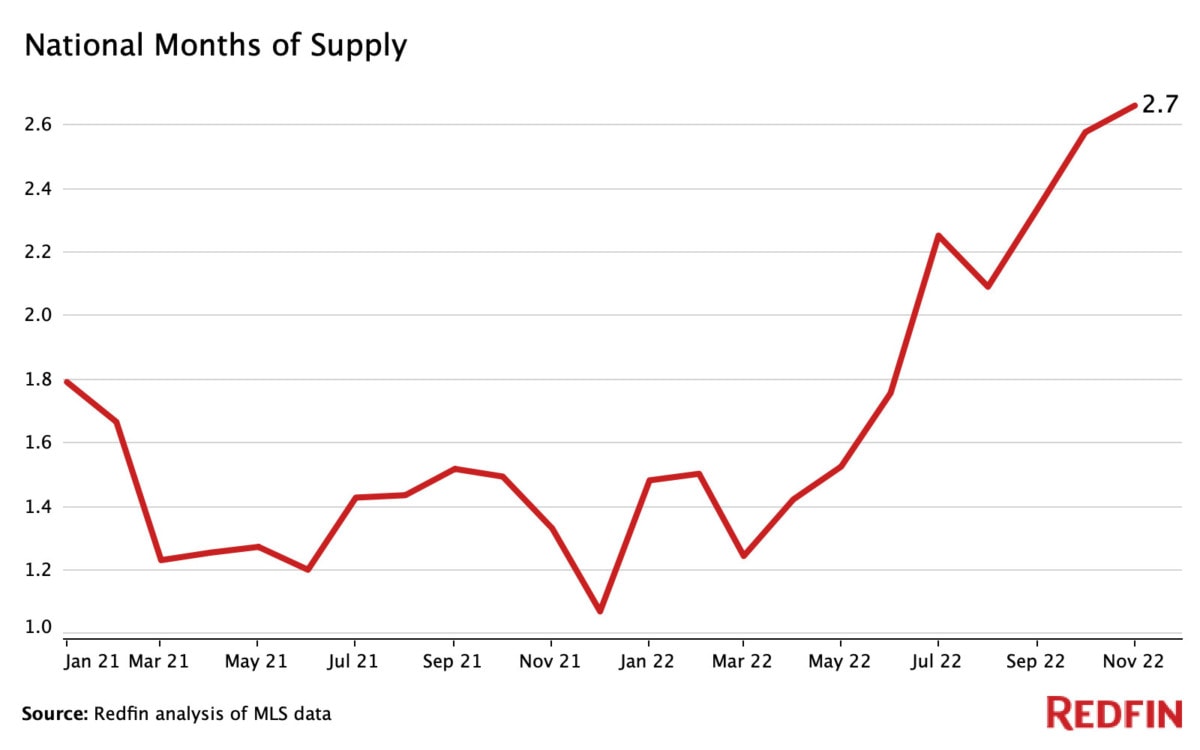
Inventory and supply are calculated in 90-day periods, e.g., January 2022 data is the three-month period from November 1, 2021, through January 31, 2022.
10. New construction took up a growing share of housing inventory
There were 1.25 million privately-owned new homes built in the U.S. through November 2022, up 3% from a year ago. As inflation rose and the market slowed, builders began slowing their production to sell off what they already had.
New construction has been taking up a growing portion of overall housing supply since 2011, when building rebounded after the financial crisis. This trend intensified in 2021 and only recently began to slow down. “If you’re a buyer, consider new construction homes,” advises Kim Stearns, a Northern Idaho Redfin agent. “Because of an inventory buildup, many builders have one to four homes they would love to close on and will often offer incentives.”
- Over 63% of new builds were single-family homes, up 2% year over year
- New construction starts dropped from their peak of 164,000 in April to 111,000 in November
Data courtesy of Census.gov.
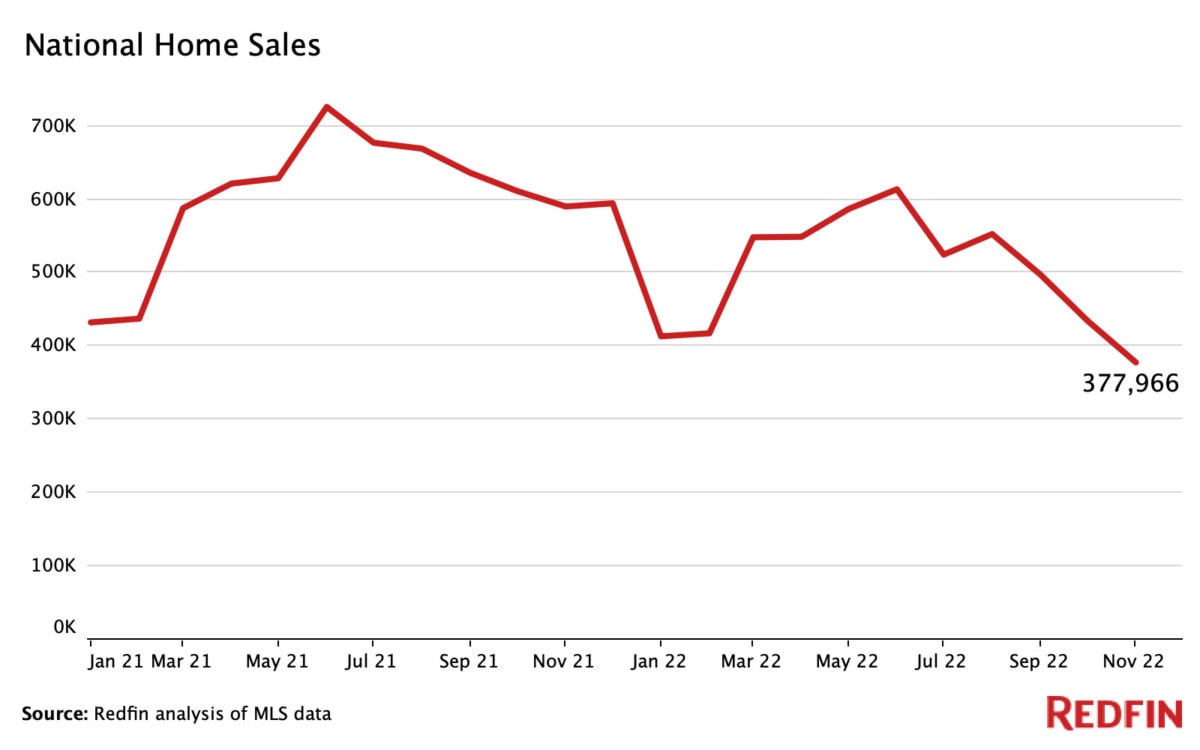
11. Home sales fell nearly 17% year over year
5.62 million U.S. homes sold through November, down 16.6% year over year, a sharp decrease from the 6.74 million sold in 2021 during the same period. In general, between four and seven million homes sell per year, with the historical average sitting at just over 5 million. Year-over-year home sales decreased in every month of 2022, with October and November posting the sharpest declines.
- Just 376,000 homes sold in November, down 37.4% year over year and a seasonally-adjusted historic low (since 2001).
- June was the busiest month with 626,641 homes sold, a 15.2% year-over-year dip.
Data was collected through November.
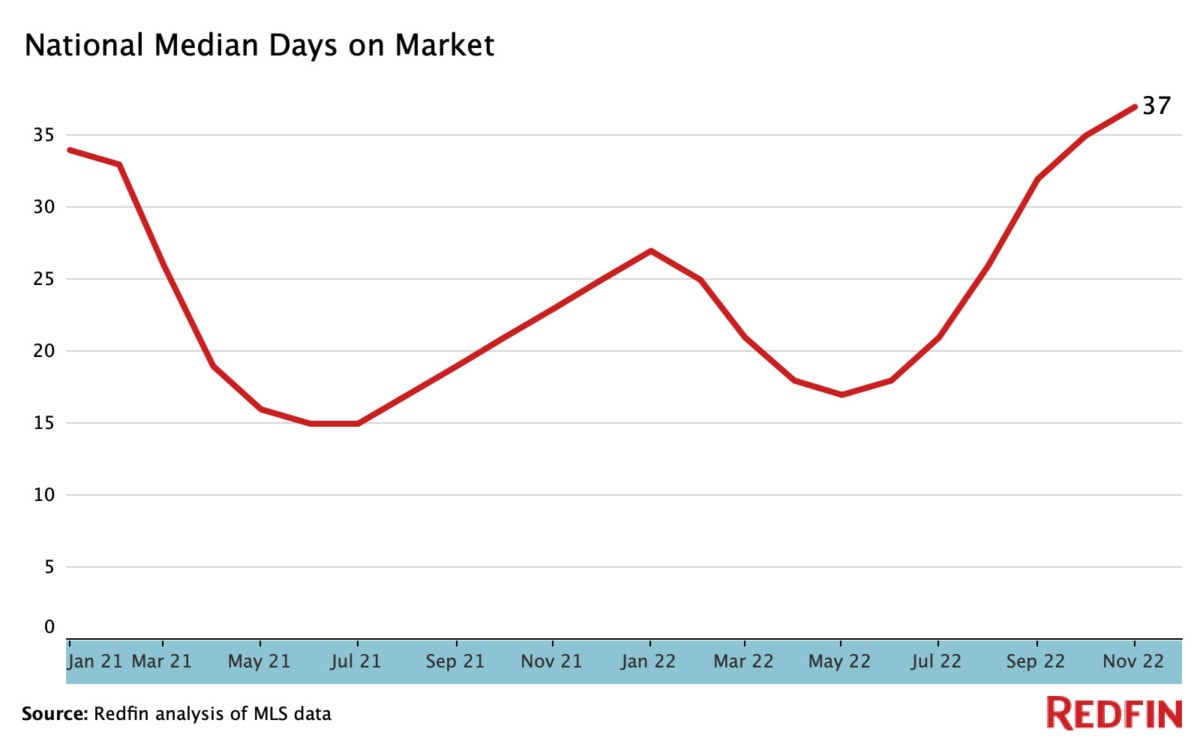
12. Median days on market rose at a record pace, signaling a dramatic turnaround from 2021’s breakneck pace
In 2022, homes spent an average of just 24 days on the market, an 8.4% increase year over year compared to the 22 days on the market in 2021. Since 2020, a housing supply crunch has been caused by supply chain issues, a chronic lack of homebuilding, and an increase in demand. In 2022, time on the market ticked up as homebuilding began to catch up to demand and high mortgage and inflation rates limited buyers’ spending power.
“Due to a slowing economy and layoffs in the tech sector near the end of the year, many buyers paused their home search due to affordability and job security,” notes Frank Vettese III, a San Francisco Redfin agent. “This was one of many factors that contributed to the dramatic slowdown in sales.”
- May was the busiest month of the year, with homes spending an average of just 17 days on the market.
- In the four weeks ending December 4th, homes spent an average of 37 days on the market, the slowest month of 2022 and the biggest year-over-year slowdown on record.
13. 14% of active home listings experienced price drops
On average, 14% of active homes for sale had price drops in 2022, up 4.7% year over year. In October, 22.6% of listings had price drops, a decades-long high. In fact, from February through July, the number of homes with price drops rose from 5.7% to 19.5%, a record-fast increase. “The shift was dramatic,” says Christy Beach, a Seattle-area Redfin agent. “The buyers who didn’t secure a home during the height of competition are now bidding low. For example, the same type of home that buyers were willing to offer $200,000 over list price are now offering $200,000 below list price.”
- In Denver, 47% of homes experienced reductions in price, the highest percentage of any major city.
- Even though price drops were common, median sale prices still increased in almost every metro in the county.
- Many pandemic-era migration hotspots, such as Tampa, Las Vegas, and West Palm Beach, had a large percentage of listings with price drops as well.
“As sellers with stale listings became increasingly anxious to get their properties sold, we saw a steep rise in price drops through the summer here in Washington State,” says Darlene Heseltine, a Tacoma, WA Redfin agent. “Currently, homes that are fresh on the market are starting to move more quickly. As mortgage rates dip further, in-demand properties may start receiving multiple offers.”
The top five cities with the highest share of price drops in 2022
Data includes the median price drops out of all active listings in each of the 50 largest metropolitan areas.
14. 55% of homes had a bidding war
55% of homes had bidding wars in 2022, down from 64% in 2021. Coastal metros experienced the highest rates of bidding wars, including Boston (69.8%) and Los Angeles (67.7%).
However, nationwide, bidding wars fell from 72% to 35% from February to November. A worsening economy, higher mortgage rates, and an increase in supply contributed to the slowdown.
Shauna Pendleton, a Boise, ID Redfin agent, advises sellers to be patient and wait for mortgage rates to drop. “Unless a home is priced $100,000 or more under market value, bidding wars are mostly non-existent. Our team still hears of a few multiple-offer situations; in these cases, it’s typically a luxury home in a high-demand neighborhood that is priced very aggressively.”
The top five metros with the highest percentage of bidding wars in 2022
Data includes the median percentage of bidding wars across active listings in each of the 50 largest metropolitan areas.
15. Over 30% of homes were purchased with cash in 2022
30.7% of homes were purchased with all cash, up 2% year over year. In October (the most recent data available), 32% of homes were paid for with all cash, up 2% year over year and the highest share since 2014.
- Florida was the most popular state for all-cash purchases, especially Jacksonville and West Palm Beach.
- Expensive west coast metros, including Oakland, San Jose, and Seattle, had the lowest share of all-cash purchases.
Data is from a Redfin analysis of county records across 39 of the most populous U.S. metropolitan areas, dating back through 2011. Data does not include November or December.
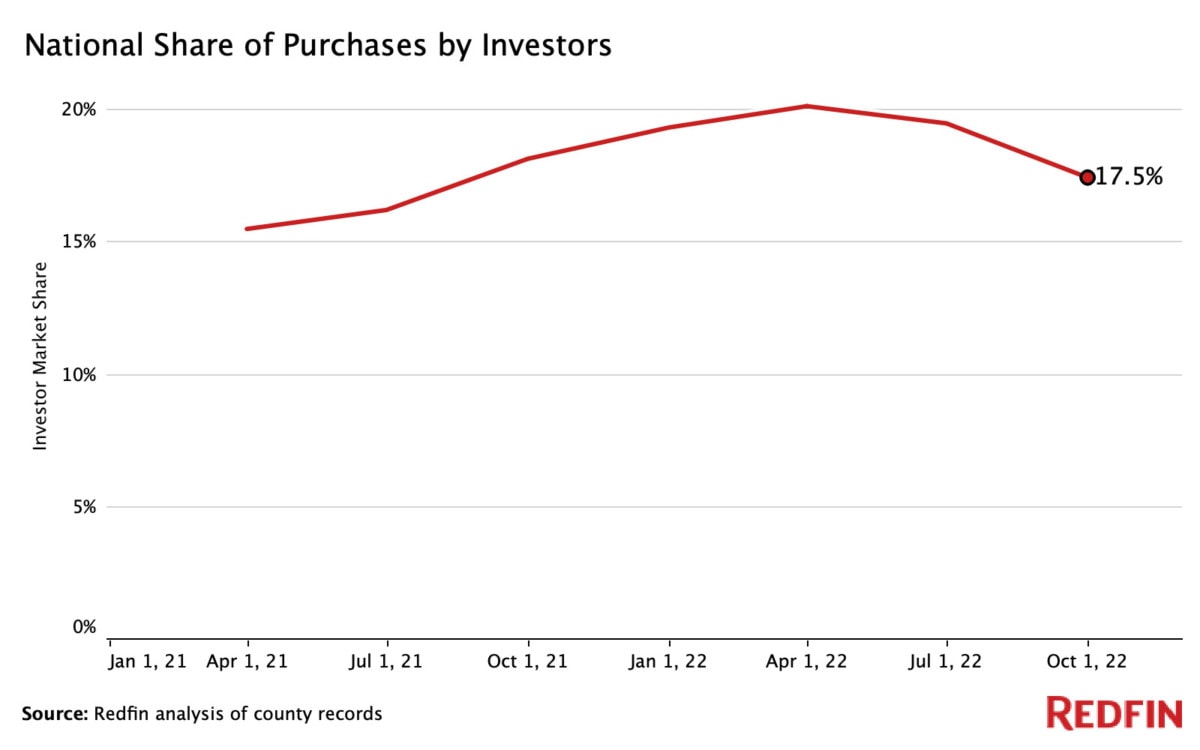
16. Real estate investors purchased nearly 20% of available listings, a new record
Vying to capitalize on the housing and rental boom, investors purchased 233,701 homes in 2022 through September, a record-breaking 19.1% of all listings. Multifamily residential properties constituted the largest percentage of investor market share, with an average of 30% of these properties being purchased by investors.
Pandemic boomtowns became the largest investor hotspots, especially in Sun-Belt metros.
The top five metros with the largest investor market shares in 2022
Data is analyzed on a quarterly basis and includes all property types unless otherwise stated. Total percentage is the average of data from January-September. Data does not include the last quarter of 2022.
17. Luxury home sales experienced their biggest year-over-year decline on record
In 2022, there were 258,733 luxury homes sold in the U.S., down 27% year over year and the biggest decline since 2012. Active listings dropped even further, falling by 32.7% year over year. The median sale price for a luxury home was $1,080,000, up 14.8% year over year. Prices reached their peak of $1,120,000 during the three months ending May, a 15.7% year-over-year increase. However, price growth, listings, and sales slowed significantly as demand cooled later in the year.
- In the three months ending November 30th, luxury home sales fell by 38.1%, the largest drop on record.
- Luxury homes spent an average of 32 days on the market through November, up 28.9% year over year
- Tampa was the fastest growing luxury market, with prices rising by 32.3% year over year
- Luxury home sales declined by 47% in San Jose, the biggest fall of any major metro
“In Seattle, luxury listings saw the largest reductions in price,” continues Seattle agent Christy Beach. “In the current market, most sellers with a price point of $1.5 million or higher need to prepare to make their home stand out among the competition. More often than not, sellers are having to negotiate their price and terms with buyers.”
Luxury homes are defined as the top 5% of listings in a given market. Values are three month moving aggregates ending on the date shown, e.g., November 2022 spans September, October, and November 2022. Data does not include the three months ending December 31.
Looking forward
The 2022 housing market was chaotic, but what does Redfin predict for 2023? Read our 2023 Housing Market Predictions to learn more.
All data was compiled by the week ending December 23, 2022. Data is aggregated from January to November and does not include December unless stated otherwise. All data is from Redfin, FRED, and/or public records. For questions about metrics, read our metrics definitions page.

The rental price per square metre per month in Barcelona averages at 21.8 euros, making the Catalan city the most expensive place to rent in Spain. Madrid is the second most expensive with an average of 17.3 euros per square metre per month. This data is contained in the report by the professional services firm EY, The Living Property Telescope 2022. According to this study, which explains Spanish real estate behaviour between March 2018 and October 2022, the increase in rental prices in Barcelona over this period has been 36% compared to an increase of 16% in Madrid. These are the details about Barcelona being the most expensive city to buy and rent a home in Spain.
The most expensive property in Spain found in Barcelona
The Living Property Telescope 2022, also points to Barcelona and Madrid as the cities where the time it takes to rent a property has reduced the most. The time to rent a property has been reduced by 56% in both areas. Specifically, in Madrid the waiting time is around 1.3 months and in Barcelona 1.4 months. The time it takes to sell a property in the two cities is also very similar, 2.3 months in Madrid, with a reduction of 40%, and 2.4 months in Barcelona, with a respective reduction of 35%.
What does not fall, but rather continues its upward trend, is the cost of property in these municipalities, which have the highest prices in Spain. The most expensive city to buy property in Spain is Barcelona, with a price per square metre of 4,220 euros, which represents an increase of 6% over the period studied. The price per square metre in Madrid is set at 4,028 euros, an increase of 8%.
The third most expensive city is Bilbao
After the two cities where it is most expensive to buy and rent, the third most expensive city in the ranking is Bilbao. The average selling price is 3,259 euros per square metre, an increase of 7%. It is also the third province with the highest rental prices, 14 euros per square metre per month, an increase of 7%. The EY study calculates the selling time in Bilbao at 4.1 months, 10% less, and the rental time at 2.2 months, which, unlike the other cities, breaks the trend, increasing by 7%.
Valencia is the second city, after Barcelona, in which the rental price has increased the most, according to the report, the increase has been 32%, standing at 12.6 euros per square metre per month. Likewise, this is also the third province in which purchase prices have risen the most, up to 13%, reaching 2,066 euros per square metre. The time it takes to sell a property in Valencia is calculated at 3.2 months, 28% less.
Málaga is where it takes the least time to rent a property
One of the cities that appears in this study is Málaga. The sixth most populated city in Spain has a rising market marked in part by the attraction it is exerting on large new technology companies. Málaga is the city where it takes the least time to rent a residence, only 0.9 months. This represents a reduction of up to 67%. It is worth noting the increase in the price of rents, up 25% to 12.8 euros per square metre per month. In Málaga, the price of homes has increased by 10%, with an average figure of 2,394 per square metre.
Price increases in Seville and Zaragoza
The EY report also points out the rise in prices in the provinces of Zaragoza and Seville. The increase in the cost of sale in Zaragoza has been 5%, standing at 1,700 euros per square metre and in Seville 4%, at 2,054 per square metre. The cost of rent has also risen in these two cities, in Zaragoza by 7%, to 9.1 euros per square metre per month, and in Seville by 8%, from 10.1 euros per square metre to 10.9. It is worth noting that the time it takes to sell a property has been considerably reduced in Seville, by 46%, which translates into an average of 2.3 months. In Zaragoza a property takes around 2.7 months to be sold. In Seville a property takes 2.2 months to be rented, 27% less and in Zaragoza 1.6, which means 33% less.
Archaic rules keep homeownership out of reach for millions. That’s about to change.
Amy Ding is the founder and CEO of lease-to-own company Requity Homes.
We’re entering 2023 with a broken housing market. Nationwide supply is low, interest rates are rising and inflation is squeezing our bank accounts every day. One recent report showed that 80 per cent of 18-to-28-year-olds are worried they won’t be able to buy a home in the city of their choice. Last year, almost 1.5 million Canadians lived in unsuitable or unaffordable conditions because they couldn’t afford to move. And some people are banking on a lottery win just to afford a home. The Canada Mortgage and Housing Corporation estimates that the country needs to build 5.8 million more homes to make housing more affordable—but that won’t happen overnight, and building more isn’t a solution by itself.
What Canada can do, much faster, is improve mortgage accessibility for the countless Canadians who can afford a mortgage but are barred from the housing market because they can’t qualify for one. Canada’s mortgage rules are antiquated and exclusionary for many groups, but especially for immigrants, gig workers and the self-employed. For example, newcomers to the country, with no Canadian credit history, are rarely granted loans. Self-employed people, meanwhile, have to show at least two years of steady income and operating history. There are more than 2.6 million self-employed people and more than 400,000 newcomers arriving in Canada each year—a number that will increase to half a million by 2025. Because of those exclusionary rules, many have no choice besides renting. It’s inexcusable to erect such barriers to home ownership, especially with rising interest rates hiking the affordability bar even higher.
In 2023, more people will be responding to those challenges by looking for creative paths to paying for a home, beyond renting or traditional mortgages. Soon, we’ll look at real estate more like we do vehicles: you can buy or finance a car, but you can also lease one for a monthly fee and decide later if you want to buy the vehicle at a set price. Why can’t we treat our housing market the same way?
I left my career in the finance industry to start Requity Homes so that I could work to disrupt home ownership this way. Requity is a real estate platform that buys property for clients, who move in and pay rent to us. We then help the client prepare to qualify for a mortgage with personalized credit coaching. When they’re mortgage-ready, they can buy the home from us—it’s a rent-to-own model. It’s also a stepping stone toward diversifying home-purchase methods in Canada. We’ve helped families in Ontario and Saskatchewan so far and plan to expand soon.
These models are common in other countries. The U.S.-based startup Divvy, for example, has helped thousands of people raise an average of US$16,000 for home purchases. And Canada’s federal government is now going ahead with its own $200-million rent-to-own fund. My company is only three years old, but we’re already looking at forming public and private partnerships to scale our model.
Canada is still a few years away from a major shift in how we think about mortgage options. In 2023, I expect that the Canadian housing market will continue to slow in terms of sales activity and price. Before the market turned, there were huge price spikes in the GTA outside of the city core, up to 30 or 40 per cent year over year. That area will likewise lead the decline, because that growth simply isn’t sustainable.
I expect Saskatchewan will buck the downward trend. It has been among the fastest-growing provincial economies in 2022, and that will continue as people move there for work and stay for the affordable cost of living. Its home prices are still among the lowest in the country, but their value increased only eight per cent during the pandemic, four times less than in Ontario. There’s lots of room to grow. Meanwhile, downtown markets in major cities like Toronto, Vancouver and Montreal will remain stable, despite a wider housing correction.
This will be a tale of two kinds of cities, with prices in some on the rise, and in others on the way down. Overall, I don’t expect much change until our thinking around mortgages evolves, and we find out which way interest rates are going to trend.
—As told to Alex Cyr
This story is part of our annual “Year Ahead” package. Read the rest of our predictions for 2023 here.
This article appears in print in the December 2022 issue of Maclean’s magazine. Buy the issue for $9.99 or better yet, subscribe to the monthly print magazine for just $39.99.
![]()

My husband and I are looking to buy a new home, but we don’t want to sell our current house now, as we think we can hold on to it until a better time to sell.
We also want to avoid the home moving stress that comes with selling and buying at the same time.
Luckily we don’t need to sell to buy and plan to sell our current home in the next year or two, hopefully when the property market picks up again. In the meantime, we will rent out the property we buy now for a year or two and then move in when we sell our current home.
Does this mean we will have to pay the extra stamp duty surcharge or can we claim this back as it is our main home? If so, will it be easy to reclaim and what steps will we have to follow to ensure we are not turned down as that could cost us dearly.
Ed Magnus of This is Money replies: Although this is a nice problem to have, you’re sensible to be considering the potential stamp duty ramifications.
The rates of stamp duty are set at a percentage of the purchase price, which varies depending on the value of the property you are buying.
For any typical home mover, who isn’t a first-time buyer, they don’t pay any stamp duty up to the value of £250,000.
This will remain the case until 31 March 2025, when the nil rate band will be reduced back to £125,000 for a typical home mover.
You can check how much you would pay to move home with our stamp duty calculator.
Related Articles
HOW THIS IS MONEY CAN HELP
Under the current stamp duty system, the portion of a property’s purchase price between £250,001 and £925,000 sees the tax charged at 5 per cent, between £925,001 and £1.5 million it rises to 10 per cent, and above £1.5 million it is charged at 12 per cent of the purchase price.
However, those purchasing an additional home on top of their main residence are required to pay an extra 3 per cent surcharge on top.
This covers buy-to-lets and also second homes and any other situation where the new property you are buying is not replacing a main residence that has already been sold.
The complication with your situation is that you think your main residence won’t be sold for another year or two and the new property won’t be your main residence to begin with.
However, the government has rules on this exact situation.
If you have not sold your main residence on the day you complete your new purchase you’ll have to pay higher rates. This is because you own two properties.
However, you can apply for a stamp duty refund if you sell your previous main home within 36 months, so it will be very important to bear this timeframe in mind.
If it takes longer than 36 months to sell your previous main home there is an exceptional circumstances scenario where you may still be able to claim the money back, you can find the stamp duty repayment rules at gov.uk.
Click here to resize this module
How much stamp duty could you claim back?
It will be important to reclaim the surcharge, as it can add up to a significant amount depending on the purchase price of the property you are intending to buy.
A £300,000 property for example without the 3 per cent surcharge will cost £2,500 in stamp duty. However, with the surcharge included, it will cost you £11,500 in tax.
A £500,000 property would cost £12,500 without the surcharge included. However with it included, the tax will set you back £27,500.
If you’re able to stomach the initial surcharge, your plan may work, given you will be able to claim it back at a later date. However, it will involve tying up money for a substantial amount of time and you will need to leave plenty of time to sell.
It may prove a way of avoiding the stresses and potential disappointment that can unfold when moving home.
It often takes months for a property sale to complete having gone under offer. Add that to a potentially long property chain of equally anxious buyers and sellers, and there is also a good chance of any deal collapsing.
Many property transactions are dependent on a chain of buyers and sellers, all relying on each other to ensure they can complete on their own purchase.
If any transaction in the chain is delayed or collapses, everyone in the chain is impacted.
We spoke to Tim Walford-Fitzgerald, a private client partner at accountancy firm HW Fisher for their tax advice and Mark Harris, chief executive of mortgage broker SPF Private Clients, on the assumption that the reader will be requiring a mortgage to fund their purchase.
What is the tax advice here?
Tim Walford-Fitzgerald replies: You’ll usually have to pay the 3 per cent surcharge on top of Stamp Duty Land Tax (SDLT) rates if buying a new residential property means that you’ll own more than one.
In your case you’ll be purchasing an additional property, and so you’ll have to pay this surcharge.
Be sure to factor this into your purchase price on completion. This surcharge applies even to the first £250,000 of the purchase price, that would normally be free from SDLT until 31 March 2025.
The good news is that as you intend the new property to become your main home, albeit not immediately, you may be able to claim a refund of that 3 per cent if you sell your existing home, and the new property becomes your home within three years of buying it.
You will have to claim the refund within 12 months of selling your current home. The form is called SDLT16 and it can be completed on-line.
You will need the details from the two transactions in order to work through the steps.
These will include the addresses and title numbers of both properties, the dates of the transactions, the unique SDLT transaction reference for the purchase of your new property and a calculation of the tax you are reclaiming.
However, if things don’t turn out the way you hope and you end up staying where you are, or if you decide to rent out your current home instead of selling it, you won’t be able to reclaim the 3 per cent surcharge.
You will also need to watch out for capital gains tax if this is not to be your final home.
The year or so renting out the property while the market improves may impact on your CGT exemption if you were to move again in the future.
This might be avoided if you were to only rent it on a short term basis, for example a holiday let style, rather than allowing someone to make it their own residents
Could you get a mortgage on another home?
Mark Harris replies: If you need a mortgage to fund the purchase, there are a few things you need to consider.
Firstly, is there a mortgage on your current property that could be moved over to the new property?
You will need to check whether your lender will allow you to port it without incurring a penalty or whether there are any consent-to-let issues.
If a mortgage is required to purchase the new property, the usual income, affordability constraints and background commitments come into play.
The lender will also want to know where the deposit money is coming from. If it is raised against the existing property to be let via a let to buy, then if you are looking to sell in the short or medium term, consideration will need to be given to the mortgage type taken.
It is also worth considering a possible fall in value if you sell your existing home at a later date, although you mention that you are holding onto it until the market picks up.
However, nobody knows when this might be and you may need to sell sooner than you would like for whatever reason, which could result in a loss.
Some links in this article may be affiliate links. If you click on them we may earn a small commission. That helps us fund This Is Money, and keep it free to use. We do not write articles to promote products. We do not allow any commercial relationship to affect our editorial independence.