

Did you know there are some financial metrics that can provide clues of a potential multi-bagger? Firstly, we’ll want to see a proven return on capital employed (ROCE) that is increasing, and secondly, an expanding base of capital employed. Basically this means that a company has profitable initiatives that it can continue to reinvest in, which is a trait of a compounding machine. Having said that, from a first glance at Westshore Terminals Investment (TSE:WTE) we aren’t jumping out of our chairs at how returns are trending, but let’s have a deeper look.
Understanding Return On Capital Employed (ROCE)
For those who don’t know, ROCE is a measure of a company’s yearly pre-tax profit (its return), relative to the capital employed in the business. Analysts use this formula to calculate it for Westshore Terminals Investment:
Return on Capital Employed = Earnings Before Interest and Tax (EBIT) ÷ (Total Assets – Current Liabilities)
0.13 = CA$160m ÷ (CA$1.4b – CA$146m) (Based on the trailing twelve months to December 2023).
So, Westshore Terminals Investment has an ROCE of 13%. On its own, that’s a standard return, however it’s much better than the 6.8% generated by the Infrastructure industry.
View our latest analysis for Westshore Terminals Investment
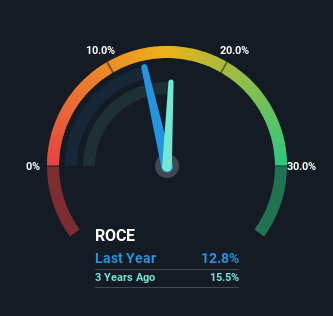
In the above chart we have measured Westshore Terminals Investment’s prior ROCE against its prior performance, but the future is arguably more important. If you’d like to see what analysts are forecasting going forward, you should check out our free analyst report for Westshore Terminals Investment .
What Does the ROCE Trend For Westshore Terminals Investment Tell Us?
In terms of Westshore Terminals Investment’s historical ROCE movements, the trend isn’t fantastic. Over the last five years, returns on capital have decreased to 13% from 17% five years ago. However, given capital employed and revenue have both increased it appears that the business is currently pursuing growth, at the consequence of short term returns. If these investments prove successful, this can bode very well for long term stock performance.
The Bottom Line
While returns have fallen for Westshore Terminals Investment in recent times, we’re encouraged to see that sales are growing and that the business is reinvesting in its operations. Furthermore the stock has climbed 61% over the last five years, it would appear that investors are upbeat about the future. So while investors seem to be recognizing these promising trends, we would look further into this stock to make sure the other metrics justify the positive view.
Westshore Terminals Investment does have some risks, we noticed 2 warning signs (and 1 which is a bit unpleasant) we think you should know about.
While Westshore Terminals Investment may not currently earn the highest returns, we’ve compiled a list of companies that currently earn more than 25% return on equity. Check out this free list here.
Have feedback on this article? Concerned about the content? Get in touch with us directly. Alternatively, email editorial-team (at) simplywallst.com.
This article by Simply Wall St is general in nature. We provide commentary based on historical data and analyst forecasts only using an unbiased methodology and our articles are not intended to be financial advice. It does not constitute a recommendation to buy or sell any stock, and does not take account of your objectives, or your financial situation. We aim to bring you long-term focused analysis driven by fundamental data. Note that our analysis may not factor in the latest price-sensitive company announcements or qualitative material. Simply Wall St has no position in any stocks mentioned.

Finding a business that has the potential to grow substantially is not easy, but it is possible if we look at a few key financial metrics. Ideally, a business will show two trends; firstly a growing return on capital employed (ROCE) and secondly, an increasing amount of capital employed. Basically this means that a company has profitable initiatives that it can continue to reinvest in, which is a trait of a compounding machine. With that in mind, we’ve noticed some promising trends at Premier Investments (ASX:PMV) so let’s look a bit deeper.
What Is Return On Capital Employed (ROCE)?
For those who don’t know, ROCE is a measure of a company’s yearly pre-tax profit (its return), relative to the capital employed in the business. To calculate this metric for Premier Investments, this is the formula:
Return on Capital Employed = Earnings Before Interest and Tax (EBIT) ÷ (Total Assets – Current Liabilities)
0.17 = AU$370m ÷ (AU$2.5b – AU$336m) (Based on the trailing twelve months to July 2023).
Thus, Premier Investments has an ROCE of 17%. In absolute terms, that’s a pretty normal return, and it’s somewhat close to the Specialty Retail industry average of 18%.
See our latest analysis for Premier Investments
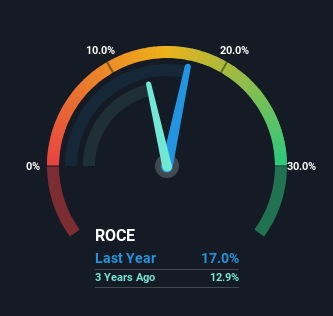
Above you can see how the current ROCE for Premier Investments compares to its prior returns on capital, but there’s only so much you can tell from the past. If you’d like, you can check out the forecasts from the analysts covering Premier Investments for free.
So How Is Premier Investments’ ROCE Trending?
Investors would be pleased with what’s happening at Premier Investments. The numbers show that in the last five years, the returns generated on capital employed have grown considerably to 17%. Basically the business is earning more per dollar of capital invested and in addition to that, 35% more capital is being employed now too. So we’re very much inspired by what we’re seeing at Premier Investments thanks to its ability to profitably reinvest capital.
The Bottom Line On Premier Investments’ ROCE
All in all, it’s terrific to see that Premier Investments is reaping the rewards from prior investments and is growing its capital base. Since the stock has returned a staggering 130% to shareholders over the last five years, it looks like investors are recognizing these changes. With that being said, we still think the promising fundamentals mean the company deserves some further due diligence.
On the other side of ROCE, we have to consider valuation. That’s why we have a FREE intrinsic value estimation for PMV on our platform that is definitely worth checking out.
While Premier Investments isn’t earning the highest return, check out this free list of companies that are earning high returns on equity with solid balance sheets.
Have feedback on this article? Concerned about the content? Get in touch with us directly. Alternatively, email editorial-team (at) simplywallst.com.
This article by Simply Wall St is general in nature. We provide commentary based on historical data and analyst forecasts only using an unbiased methodology and our articles are not intended to be financial advice. It does not constitute a recommendation to buy or sell any stock, and does not take account of your objectives, or your financial situation. We aim to bring you long-term focused analysis driven by fundamental data. Note that our analysis may not factor in the latest price-sensitive company announcements or qualitative material. Simply Wall St has no position in any stocks mentioned.

Finding a business that has the potential to grow substantially is not easy, but it is possible if we look at a few key financial metrics. Amongst other things, we’ll want to see two things; firstly, a growing return on capital employed (ROCE) and secondly, an expansion in the company’s amount of capital employed. Put simply, these types of businesses are compounding machines, meaning they are continually reinvesting their earnings at ever-higher rates of return. So, when we ran our eye over AutoZone’s (NYSE:AZO) trend of ROCE, we really liked what we saw.
Understanding Return On Capital Employed (ROCE)
If you haven’t worked with ROCE before, it measures the ‘return’ (pre-tax profit) a company generates from capital employed in its business. Analysts use this formula to calculate it for AutoZone:
Return on Capital Employed = Earnings Before Interest and Tax (EBIT) ÷ (Total Assets – Current Liabilities)
0.46 = US$3.7b ÷ (US$17b – US$8.8b) (Based on the trailing twelve months to February 2024).
So, AutoZone has an ROCE of 46%. That’s a fantastic return and not only that, it outpaces the average of 14% earned by companies in a similar industry.
See our latest analysis for AutoZone
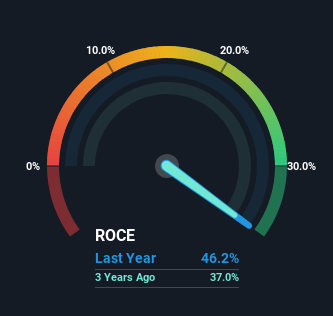
Above you can see how the current ROCE for AutoZone compares to its prior returns on capital, but there’s only so much you can tell from the past. If you’d like to see what analysts are forecasting going forward, you should check out our free analyst report for AutoZone .
The Trend Of ROCE
In terms of AutoZone’s history of ROCE, it’s quite impressive. The company has employed 80% more capital in the last five years, and the returns on that capital have remained stable at 46%. Returns like this are the envy of most businesses and given it has repeatedly reinvested at these rates, that’s even better. If AutoZone can keep this up, we’d be very optimistic about its future.
Another thing to note, AutoZone has a high ratio of current liabilities to total assets of 52%. This can bring about some risks because the company is basically operating with a rather large reliance on its suppliers or other sorts of short-term creditors. Ideally we’d like to see this reduce as that would mean fewer obligations bearing risks.
Our Take On AutoZone’s ROCE
In summary, we’re delighted to see that AutoZone has been compounding returns by reinvesting at consistently high rates of return, as these are common traits of a multi-bagger. And long term investors would be thrilled with the 220% return they’ve received over the last five years. So even though the stock might be more “expensive” than it was before, we think the strong fundamentals warrant this stock for further research.
On a final note, we found 3 warning signs for AutoZone (1 makes us a bit uncomfortable) you should be aware of.
High returns are a key ingredient to strong performance, so check out our free list ofstocks earning high returns on equity with solid balance sheets.
Have feedback on this article? Concerned about the content? Get in touch with us directly. Alternatively, email editorial-team (at) simplywallst.com.
This article by Simply Wall St is general in nature. We provide commentary based on historical data and analyst forecasts only using an unbiased methodology and our articles are not intended to be financial advice. It does not constitute a recommendation to buy or sell any stock, and does not take account of your objectives, or your financial situation. We aim to bring you long-term focused analysis driven by fundamental data. Note that our analysis may not factor in the latest price-sensitive company announcements or qualitative material. Simply Wall St has no position in any stocks mentioned.