
- The number of homes for sale in Cape Coral, FL and North Port, FL surged roughly 50% from a year earlier in March—more than anywhere else in the country. And in McAllen, TX, supply jumped 25%.
- Housing supply is soaring because both states have been building a lot of homes, which is limiting home price growth. Buyer demand is also lackluster because many people are priced out. And in Florida, an insurance crisis is throwing a wrench into deals.
- Nationwide, new listings slowed in March as mortgage rates remained elevated. The Fed recently warned rates are likely to stay high longer than expected.
On the west coast of Florida, housing supply is surging, sellers are cutting their asking prices and the time it takes to sell a home is soaring—all at a faster rate than anywhere else in the U.S. The story is similar in parts of Texas.
Florida and Texas have been building more homes than anywhere else in the country, partly to accommodate the flood of newcomers that showed up during the pandemic homebuying boom. But the boom is over, in part because many people have been priced out. Now, homes are sitting on the market and price growth is stagnating.
Here’s how these trends showed up in U.S. housing-market data for March, which covers 85 major metropolitan areas:
- Supply: Of the 10 metro areas that posted the largest year-over-year increases in supply, six are in Florida and two are in Texas. Cape Coral, FL saw the biggest jump in homes for sale (51%), followed by North Port-Sarasota, FL (48%), Fort Lauderdale, FL (30%), Tampa, FL (29%), McAllen, TX (25%), Orlando, FL (23%), Knoxville, TN (23%), Dallas (20%), West Palm Beach, FL (20%) and Cincinnati (17%).
- Price drops: Of the 10 metro areas where sellers were most likely to cut their list prices, five are in Florida and two are in Texas. In North Port-Sarasota, 48% of listings had a price cut—the highest share in the country. Next came Tampa (44%), Indianapolis (43%), Cape Coral (41%), Denver (37%), Orlando (35%), Portland, OR (34%), Houston (33%), San Antonio (33%) and Jacksonville, FL (33%).
- Prices: Median sale prices fell from a year earlier in three metros, one of which is in Florida and one of which is in Texas: North Port-Sarasota (-4.6%), Oklahoma City (-1.5%) and San Antonio (-0.3%). Prices climbed least in Austin, TX (0%), El Paso, TX (0.5%), Memphis, TN (0.7%), Tampa (1.1%), Salt Lake City (1.1%), Omaha, NE (1.2%) and Charleston, SC (1.2%).
- Speed of sales: Of the 10 metros that saw the biggest upticks in median days on market, two are in Florida and two are in Texas: In Cape Coral, the typical home took 31 more days to sell than a year earlier—the largest jump in the nation. Next came North Port-Sarasota (20), McAllen (20), New Orleans (18), Tulsa, OK (13), Cincinnati (13), San Antonio (10), Greensboro, NC (8), Honolulu (7) and Knoxville (7).
“Out-of-town homebuyers no longer see Florida as a place to get amazing value. Now they’re moving to North Carolina or Tennessee to get a good deal. Many local blue-collar workers have been priced out of homeownership, too,” said Eric Auciello, a local Redfin sales manager. “Two years ago, the North Port metro was one of the most competitive housing markets in the country because it was affordable for remote workers and there was a shortage of homes for sale, but none of those things are true today. Sarasota, in particular, has been overvalued for decades, and the chickens have finally come to roost. The Tampa metro has been faring a bit better.”
Individual home sellers are having a tough time attracting buyers in part because builders are offering concessions that are hard for buyers to refuse. As a result, listings from regular sellers are sitting on the market. But homes are also sitting because many sellers are pricing their properties too high, and then being forced to cut later, Auciello said.
“The sharp ascent in Florida housing prices in recent years has driven a lot of homeowners to cash in on their equity, but some of them are having a hard time adjusting to the fact that it’s a buyer’s market,” Auciello said. “My advice to sellers is to price your home fairly; the comps from six months ago don’t exist now. And if you’re a buyer, know that the odds of getting an offer accepted below market value are pretty high.”
The insurance crisis in Florida is also throwing a wrench into home purchases and in some cases delaying deals. Nearly three-quarters of Florida homeowners say they or the area they live in has been affected by rising home insurance costs or changes in coverage, a recent Redfin survey found.
“One of our agents is representing a buyer who thought he’d be able to get insurance for $2,000 per year—the rate the existing homeowner has. But he found out at the eleventh hour that his insurance will be $4,000 because the house has had water damage. We’re seeing sellers offer a lot of concessions to hold deals together,” said Auciello, whose own home insurance is now $14,000 a year all in, up from around $8,000 two years ago. “We’re at an inflection point. A hefty insurance bill isn’t always a big deal for a luxury buyer, but it can be a really big issue for someone buying a waterfront home on a smaller budget.”
Connie Durnal, a Redfin Premier real estate agent in Dallas, said her market has also been sluggish.
“Last year was by far the slowest market I’ve seen in my 20 years as a real estate agent,” Durnal said. “Move-up buyers are almost nonexistent. Even though a lot of homeowners have built up a ton of equity, many don’t want to sell because their monthly payment would double or triple due to high mortgage rates.”
Nationwide, New Listings Slowed in March and Prices Rose From a Year Earlier
New listings dropped 6% month over month in March—the largest decline on a seasonally adjusted basis since January 2022. They rose 6% from a year earlier, but that marks a deceleration from the 14% annual gain in February.
New listings may have slowed because mortgage rates are staying higher longer than expected, which is exacerbating the lock-in effect. The average 30-year-fixed mortgage rate in March was 6.82%—the highest since December—and the Federal Reserve has warned that elevated inflation will probably delay the interest-rate cuts they had been planning this year.
Active listings, or the total number of homes for sale, rose 1% from February—the smallest seasonally adjusted increase since August—though their 4% increase from a year earlier was the biggest annual gain in 12 months.
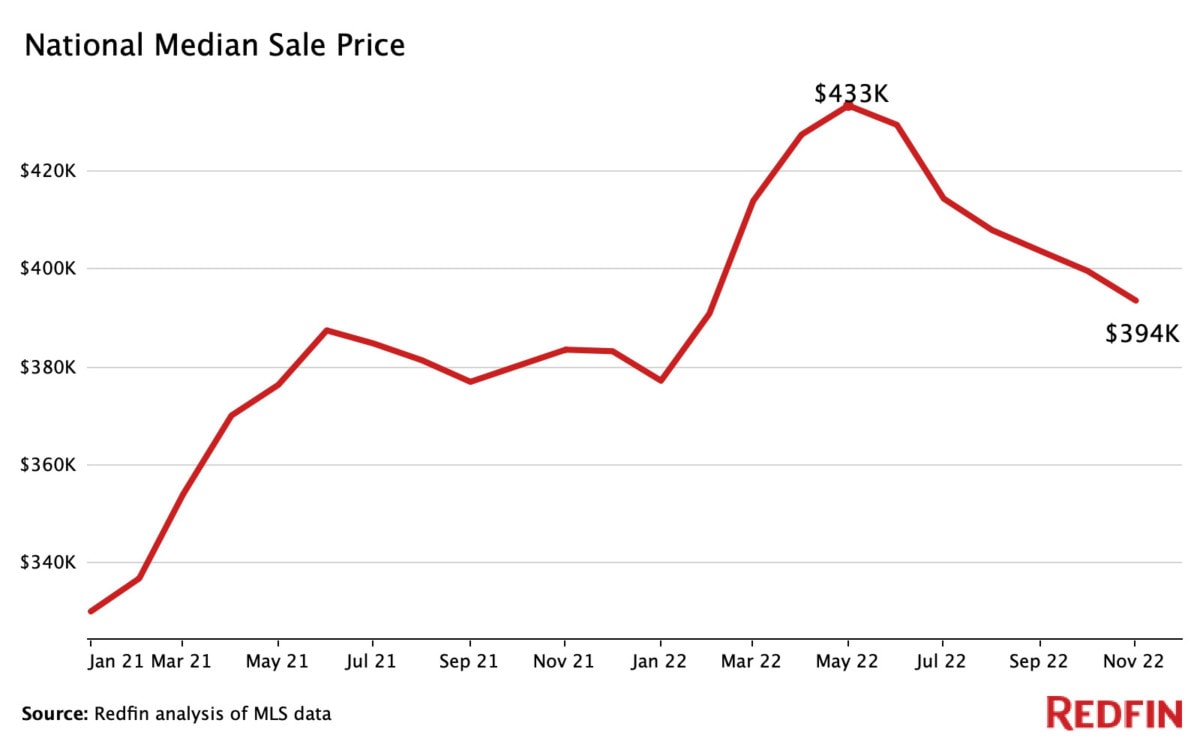
Prices continued to rise, in part because there’s still a shortage of homes for sale. The median U.S. home sale price rose 5% year over year in March to $420,357, just 3% below the record high of $432,496 set in May 2022.
Home sales were roughly flat compared with a month earlier on a seasonally adjusted basis, and were down 3% from a year earlier.
March 2024 Highlights: United States
| March 2024 | Month-Over-Month Change | Year-Over-Year Change | |
|---|---|---|---|
| Median sale price | $420,357 | 2.1% | 4.8% |
| Homes sold, seasonally adjusted | 423,273 | -0.2% | -2.6% |
| New listings, seasonally adjusted | 509,405 | -6.3% | 6.1% |
| All homes for sale, seasonally adjusted (active listings) | 1,600,310 | 0.6% | 4.3% |
| Months of supply | 2.4 | -0.5 | 0.3 |
| Median days on market | 40 | -8 | -4 |
| Share of for-sale homes with a price drop | 16.3% | 1.1 ppts | 2.8 ppts |
| Share of homes sold above final list price | 30.0% | 3.8 ppts | 1.6 ppts |
| Average sale-to-final-list-price ratio | 99.2% | 0.5 ppts | 0.4 ppts |
| 6.82% | 0.04 ppts |
0.28 ppts |
Note: Data is subject to revision
Metro-Level Highlights: March 2024
Data in the bullets below came from a list of 85 U.S. metro areas with populations of at least 750,000. Select metros may be excluded from time to time to ensure data accuracy. A full metro-level data table can be found in the “download” tab of the dashboard in the monthly section of the Redfin Data Center. Refer to our metrics definition page for explanations of metrics used in this report. Metro-level data is not seasonally adjusted. All changes below represent year-over-year changes.
- New listings: New listings rose most from a year earlier in Sacramento, CA (20%), San Jose, CA (18%) and Las Vegas (15%). They fell most in Boston (-18%), Rochester, NY (-16%) and Atlanta (-14%).
- Closed home sales: Closed sales rose most in San Jose (3%), Milwaukee (2%) and Tulsa (2%). They fell most in Tacoma, WA (-24%), West Palm Beach (-24%) and Grand Rapids, MI (-22%).
- Sold above list price: In San Jose, 72% of homes sold above their final list price, the highest share among the metros Redfin analyzed. Next came Rochester (69%) and Oakland, CA (66%). The shares were lowest in North Port (7%) West Palm Beach (8%) and Cape Coral (8%).
- Off market in two weeks: In Rochester, 82% of homes that went under contract did so within two weeks—the highest share among the metros Redfin analyzed. Next came Seattle (77%) and Grand Rapids (75%). The lowest shares were in Honolulu (10%), Tucson, AZ (18%) and McAllen (20%).
17 housing trends that defined the year, including record home prices and sky-high mortgage rates
The 2022 housing market was nothing short of remarkable. The pandemic and resulting remote work continued to define how, when, and where people bought homes. The median U.S. home price hit a record high before falling slightly. Rising rents stretched renters’ budgets. High inflation put increased pressure on almost everyone. For the first time in history, mortgage rates doubled in the span of just one year. The list goes on.
In general, 2022 was a reaction to the dramatic real estate boom in 2021. The year started with a surge in prices and growth across the board before falling alongside record inflation in the fall. November and December saw a much slower and seasonally-expected housing market, with year-over-year changes in rent prices, house prices, and interest rates either falling or slowing down.
Below is a non-exhaustive list of data points and visuals that defined the 2022 housing market.
1. Home prices rose to an all-time high
In May, the typical home sold for $430,365, a record high since records began in 1963, shattering 2021’s high of $386,000. In March, the median sale price rose 16.8% year over year, the largest percentage increase over the last five years. Following the pandemic, demand skyrocketed while supply remained historically low, causing a severe housing shortage and price boom that continued throughout 2021 and peaked midway through 2022. In April and May, mortgage rates rose to combat rising inflation, which began reversing housing trends from earlier in the year.
Despite a quickly cooling housing market, prices are still higher today than any previous year on record.
2. San Francisco was the most expensive metro area for homebuyers in 2022
The median sale price of a home in San Francisco was $1,505,000 in 2022, up 0.3% year over year. For one week in April, the median price reached a high of $1,700,000, just below 2021’s all-time high of $1,728,000. As the year went on, prices dropped closer to pre-pandemic levels, which will likely continue until mortgage rates fall further.
- Six of the top ten most expensive metros were in California.
- Many Florida metros experienced the largest year-over-year price growth, including Tampa (18%), Orlando (14.9%), Jacksonville (14.7%), and Miami (14.2%).
- Tampa had the largest year-over-year price growth of all large metros in the country.
The top ten most expensive cities to buy a home in 2022
City |
Median sale price |
Year-over-year change |
| $1,505,000 |
+0.3% |
|
| $1,435,000 |
+7.2% |
|
| $970,000 |
+10.4% |
|
| $939,000 |
+4.2% |
|
| $850,000 |
+7.0% |
|
| San Diego, CA | $815,000 |
+10.3% |
| $777,000 |
+9.3% |
|
| $683,000 |
+5.5% |
|
| $650,000 |
+7.7% |
|
| $600,000 |
+5.8% |
Data includes the yearly aggregated median sale prices out of all homes sold in each of the 50 largest metropolitan areas. Data does not take into account local median incomes and home affordability.
3. Detroit was the least expensive metro area for homebuyers in 2022
The median sale price for a home in Detroit was $165,000 in 2022, up 3.3% year over year. Home prices in Detroit hit $213,000 for a week in June, making it the most expensive month of the year but still nearly 50% lower than the national median. In general, year-over-year price increases in 2022 were smaller across most major metros than in 2021, and growth dipped further heading into the first week of December.
- The top ten least expensive metros were all located in the Rust Belt, a geographic region near the Great Lakes.
- Philadelphia was the only large metro that experienced a price decrease in 2022.
- Kansas City, MO was the eleventh least expensive metro, and the first non-Rust-Belt metro on the list.
The top ten least expensive cities to buy a home in 2022
City |
Median sale price |
Year-over-year change |
| $165,000 |
+3.3% |
|
| $185,000 |
+5.4% |
|
| $205,000 |
+2.4% |
|
| $235,000 |
+9.6% |
|
| $239,000 |
+7.7% |
|
| $249,900 |
-0.01% |
|
| $260,000 |
+4.8% |
|
| $262,000 |
+4.5% |
|
| $275,000 |
+11.6% |
|
| $290,000 |
+10.3% |
Data includes the yearly aggregated median sale prices out of all homes sold in each of the 50 largest metropolitan areas. Data does not take into account local median incomes and home affordability.
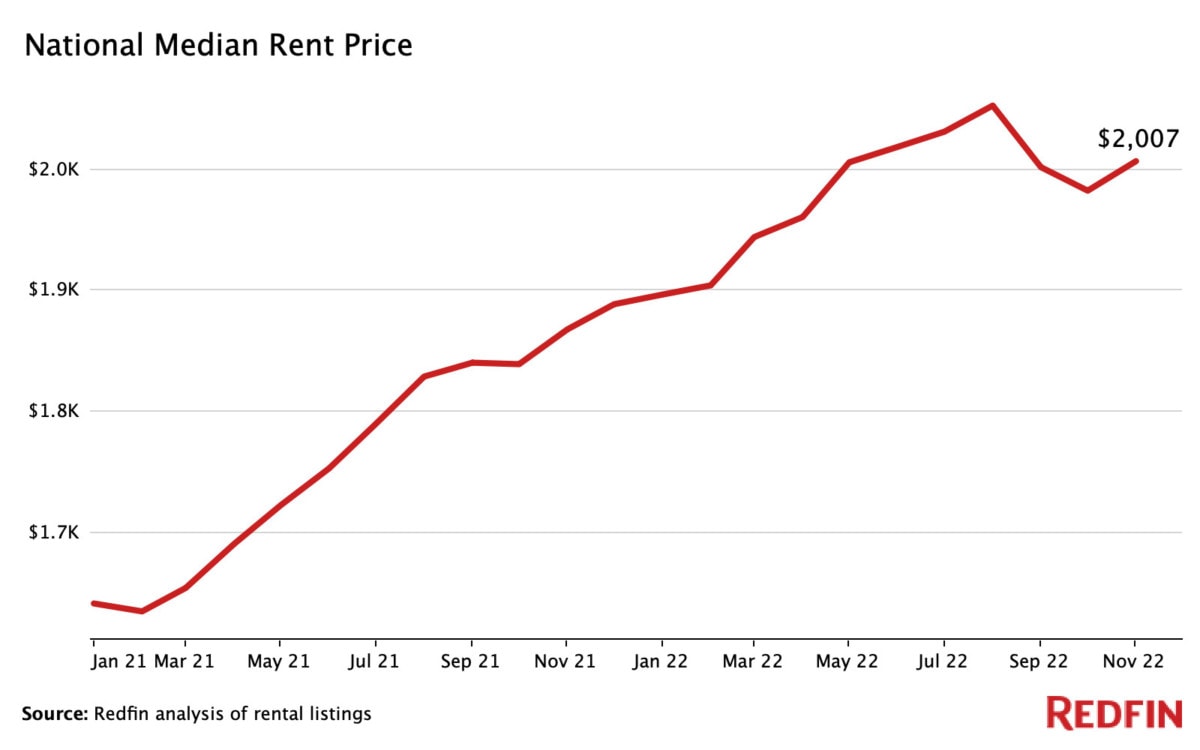
4. Rent prices rose dramatically as supply struggled to keep up with demand
Rent prices in 2022 were 12.8% higher than they were in 2021. Nationwide, the median rent price rose to $2,053 in August before dipping slightly, the highest on record and a 12.3% increase year-over-year. Following the pandemic, rent prices skyrocketed largely because of a lack of supply and a boom in demand, both of which are just now balancing out.
- Median rent prices in New York rose to over $4,000, retaining its dominance as the most expensive metro for renters in the country.
- Many of the least expensive metros experienced the highest year-over-year rent increases, including Oklahoma City (23.3%), Cincinnati (17.6%), and Pittsburgh (14.8%).
- Oklahoma City experienced the highest year-over-year rent increases in the country.
- Rent growth has consistently outpaced wages for decades, but the most recent data states that a staggering 40% of renters spent more than 30% of their income on rent from 2017-2021.
There are currently over 1.1 million rental units under construction in the U.S., which will come available for rent over the next year, helping to alleviate part of the housing shortage.
“We expect rents to fall in nearly every part of the country by the middle of 2023 as supply starts overtaking demand,” notes Taylor Marr, Redfin Deputy Chief Economist. “While renters typically get the best deal during the winter months as demand is lower, rents are continuing to ease. Because of this, there won’t be as much of a seasonal increase come spring, and thus patience for a good deal will pay off. And don’t be afraid to negotiate; some landlords may be open to concessions like a free month’s rent or free parking.”
The top ten most expensive cities for renters in 2022
City |
Median rent price |
Year-over-year change |
| $4,043 |
+10.8% |
|
| $3,764 |
+3.1% |
|
| $3,749 |
+7.6% |
|
| $3,558 |
+7.3% |
|
| $3,435 |
+0.8% |
|
| $3,345 |
+8.2% |
|
| $3,098 |
+8.7% |
|
| $2,994 |
+7.0% |
|
| $2,749 |
+6.7% |
|
| $2,700 |
+4.6% |
The top ten least expensive cities for renters in 2022
City |
Median rent price |
Year-over-year change |
| $1,308 | +23.3% | |
| $1,372 |
+13.2% |
|
| $1,442 |
+12.4% |
|
| $1,447 |
+4.7% |
|
| $1,454 |
+13.9% |
|
| $1,456 |
+3.1% |
|
| $1,547 |
+4.8% |
|
| $1,555 |
+9.7% |
|
| $1,571 |
+4.8% |
|
| Memphis, TN | $1,581 |
+9.5% |
Data includes the 2022 aggregated median rent prices for each of the 50 largest metropolitan areas compared to 2021 data from the same period. Data is the median of all 0-3 bedroom rental homes.
5. Homebuyers looking to relocate favored Sun-Belt cities
24.1% of homebuyers looked to move to a different metro during the three months ending in November. This is on par with the record high of 24.2% in the third quarter and up from 19.1% in 2019.
- Homebuyers looked to move to sunny, relatively affordable areas, with Miami, Tampa, Las Vegas, and Phoenix being the most popular destinations.
- Homebuyers looked to move away from expensive coastal metros like San Francisco, Los Angeles, and New York, which topped the list.
- 100% of homes in many popular relocation metros experienced severe drought in the past year, including Phoenix, Las Vegas, and Sacramento.
“Similar to 2021, continued growth in remote work and a desire for housing affordability drove relocation patterns in 2022,” Marr continues. “However, trends in some popular destinations reversed course after they became too popular, competitive, and expensive. Cities like Salt Lake City, Phoenix, Tucson, Dallas, and San Antonio all declined in popularity in 2022.”
Data is the percent of Redfin.com users searching for homes outside their metro. Data is the year median aggregate of multiple three month moving aggregates and does not include September-December. Keep up with the latest migration news here.
6. Inflation rose at a record pace, affecting every facet of the housing market
The prices of goods and services rose to 6.48% year over year in November, the highest percentage since August 1982 and more than double the rate from November 2021. In fact, inflation rates have doubled compared to the previous year in every month since June. Rising prices severely limited consumer spending and slowed nearly every facet of the housing market.
-
- To combat the historic inflation, the Fed raised its target interest rate to 4.5%, the highest in 15 years.
- Skyrocketing interest rates caused mortgage rates to rise and increased fears of a recession, keeping homebuyers out of the housing market.
- Inflation rose the fastest in pandemic boomtowns due partly to the sudden jump in house prices, which is a key contributor to inflation.
Data courtesy of FRED. Data measures core CPI (less food and energy) through November 2022.
7. Mortgage rates ballooned to nearly 7% in response to record inflation
After decades of falling mortgage rates, in 2022, rates climbed to nearly 7% in both October and November, higher than any point since 2002. In fact, from October 2021 to October 2022, mortgage rates doubled in one year for the first time in history.
As the year came to a close, optimistic inflation data helped reduce housing interest rates to below 7%.
- In popular migration metros like Phoenix, Las Vegas, and Austin, higher mortgage rates and expensive home prices hurt buyers the most.
- In Phoenix, for example, as mortgage rates climbed in May and June, only 21.5% of homes were affordable to buyers with a $2,500 monthly mortgage budget – a 28.5% drop from 2021.
High inflation and rising mortgage rates often deter buyers, but if you’re able to afford it, ownership may be the better option. “Homeownership is a long-term investment that can lead to significant net worth gains, even with rates above 6%,” advises Dean Hayes, Area Sales Manager with Bay Equity, a Redfin company. “Mortgage rates will likely go down in the new year, meaning more home buyers will return to the market, creating increased competition and less room for negotiation.”

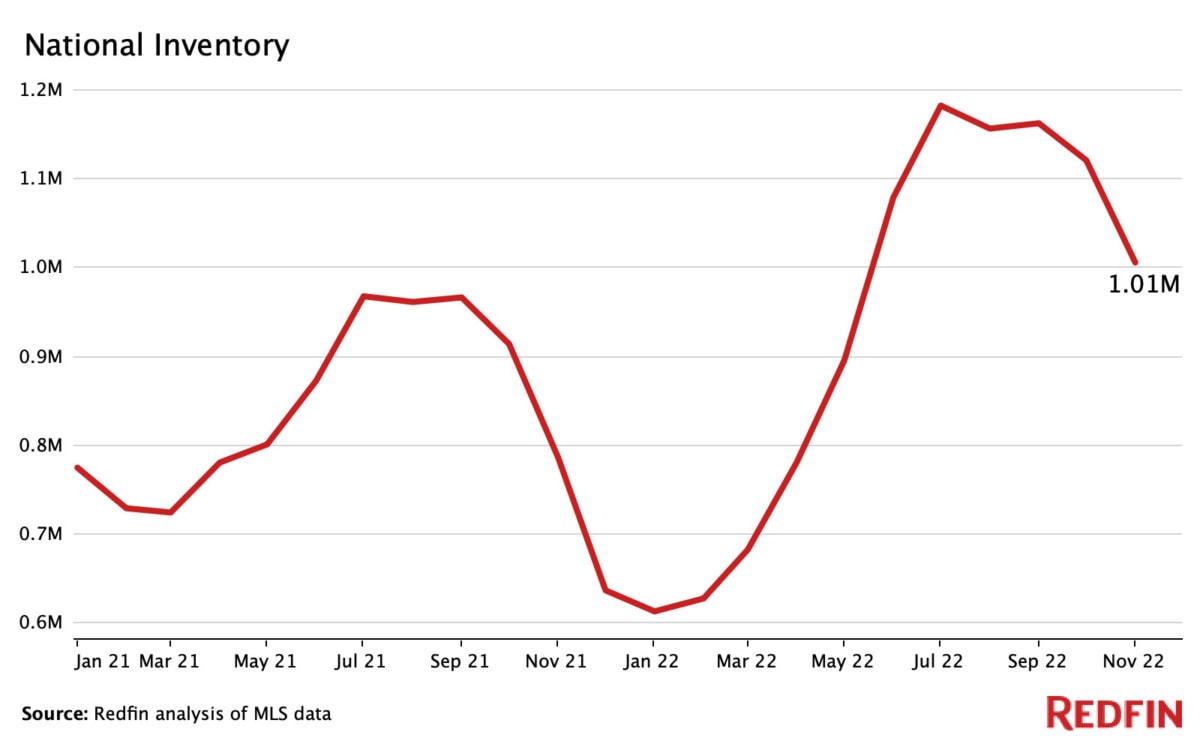
8. Housing inventory rose after hitting a record low
10.7 million homes were listed for sale through November, up 11.2% compared to the 9.5 million homes listed through November in 2021. In the three months ending November 2022, the number of homes for sale increased by 15% year over year, the biggest increase on record.
As mortgage rates rose alongside inflation, more buyers decided to stay put, allowing inventory to increase. Since December 2019, inventory has declined year over year until it finally rose in June 2022.
“Buyers have more leverage now than they have since 2010,” advises San Francisco Redfin agent Josh Felder. “Even with higher mortgage rates, if you intend to stay put for longer than five years, it’s a great investment. Homes are forecast to still appreciate, even in light of current circumstances. Sellers should understand that the market is still moving. Homes don’t sell in five days, well over list price, anymore.”
Inventory and supply are calculated in rolling 90-day periods, e.g., January 2022 data is the three-month period from November 1, 2021, through January 31, 2022.
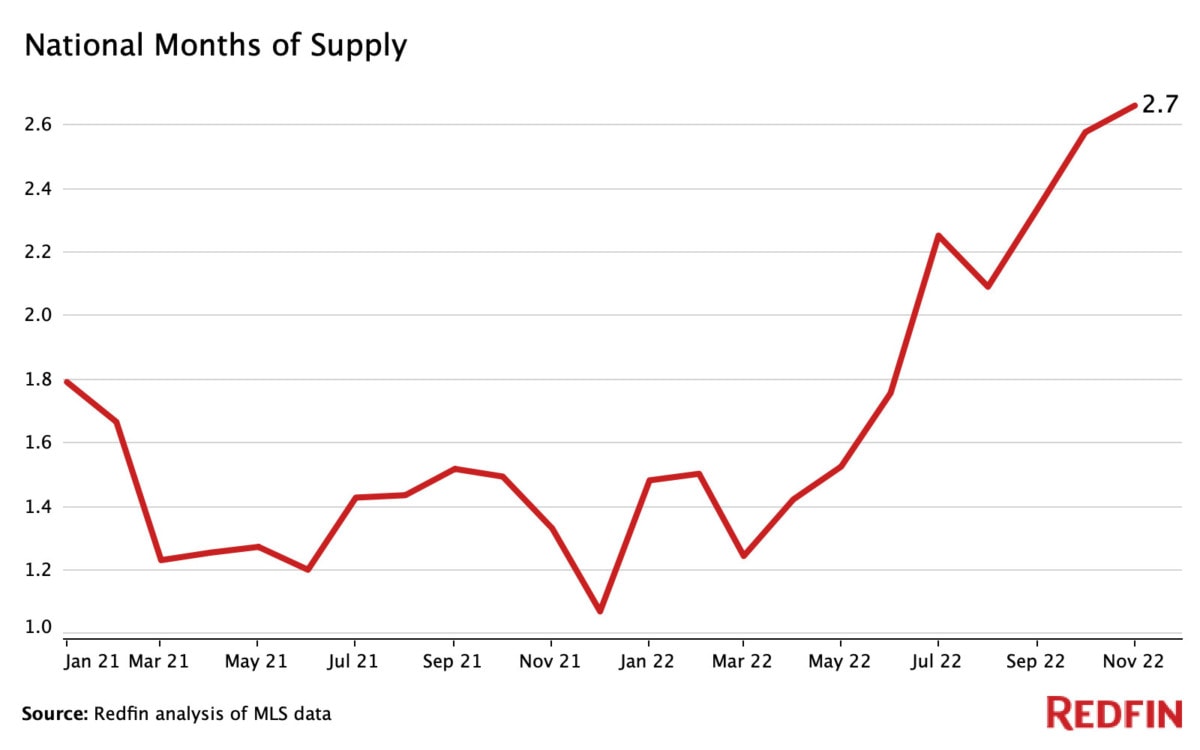
9. Months of supply dropped to a near-record low of just 1.2 months
While inventory measures the number of homes currently available for sale, months of supply measures the amount of time it would take those homes to sell. Four to five months of housing supply is considered the optimal benchmark. Less than three months of housing supply often means that there are more buyers than sellers, while a higher number means there are more sellers than buyers. Inventory and supply typically move together.
Nationwide, months of housing supply dipped to just over 1.2 months in March before slowly rebounding in the summer. Year over year, months of supply has declined almost every month since January 2020.
- As buyers retreated due to high inflation and interest rates, months of supply began to grow in July and August, reaching 2.3 months of supply by September.
- In Seattle, months of supply reached a near-record low of just 15.5 days in January and February, the lowest of any major metropolitan area.
“We are quickly working back toward a balanced market, which is three to six months of inventory,” says Seattle-area Redfin agent Brian Shields. “We’ve been in a seller’s market with less than five months of inventory for several years, until midway through this year. Buyers now have a lot more choices than they did last Spring.”
Inventory and supply are calculated in 90-day periods, e.g., January 2022 data is the three-month period from November 1, 2021, through January 31, 2022.
10. New construction took up a growing share of housing inventory
There were 1.25 million privately-owned new homes built in the U.S. through November 2022, up 3% from a year ago. As inflation rose and the market slowed, builders began slowing their production to sell off what they already had.
New construction has been taking up a growing portion of overall housing supply since 2011, when building rebounded after the financial crisis. This trend intensified in 2021 and only recently began to slow down. “If you’re a buyer, consider new construction homes,” advises Kim Stearns, a Northern Idaho Redfin agent. “Because of an inventory buildup, many builders have one to four homes they would love to close on and will often offer incentives.”
- Over 63% of new builds were single-family homes, up 2% year over year
- New construction starts dropped from their peak of 164,000 in April to 111,000 in November
Data courtesy of Census.gov.
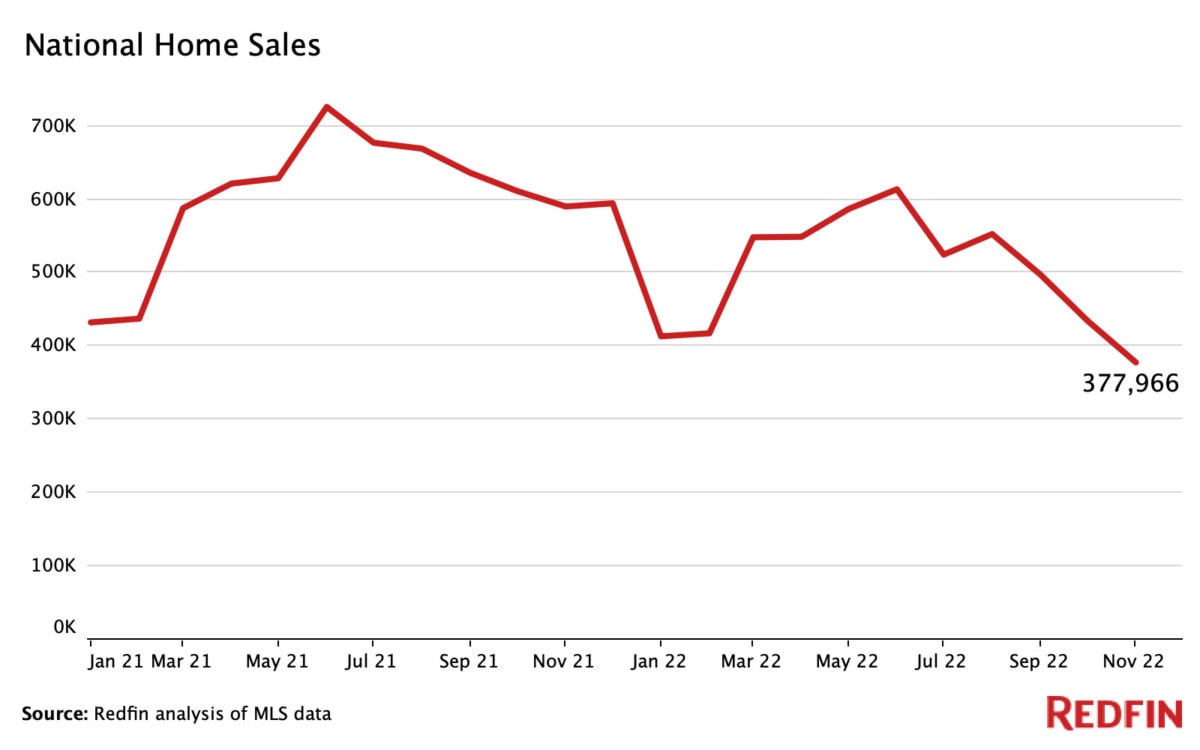
11. Home sales fell nearly 17% year over year
5.62 million U.S. homes sold through November, down 16.6% year over year, a sharp decrease from the 6.74 million sold in 2021 during the same period. In general, between four and seven million homes sell per year, with the historical average sitting at just over 5 million. Year-over-year home sales decreased in every month of 2022, with October and November posting the sharpest declines.
- Just 376,000 homes sold in November, down 37.4% year over year and a seasonally-adjusted historic low (since 2001).
- June was the busiest month with 626,641 homes sold, a 15.2% year-over-year dip.
Data was collected through November.
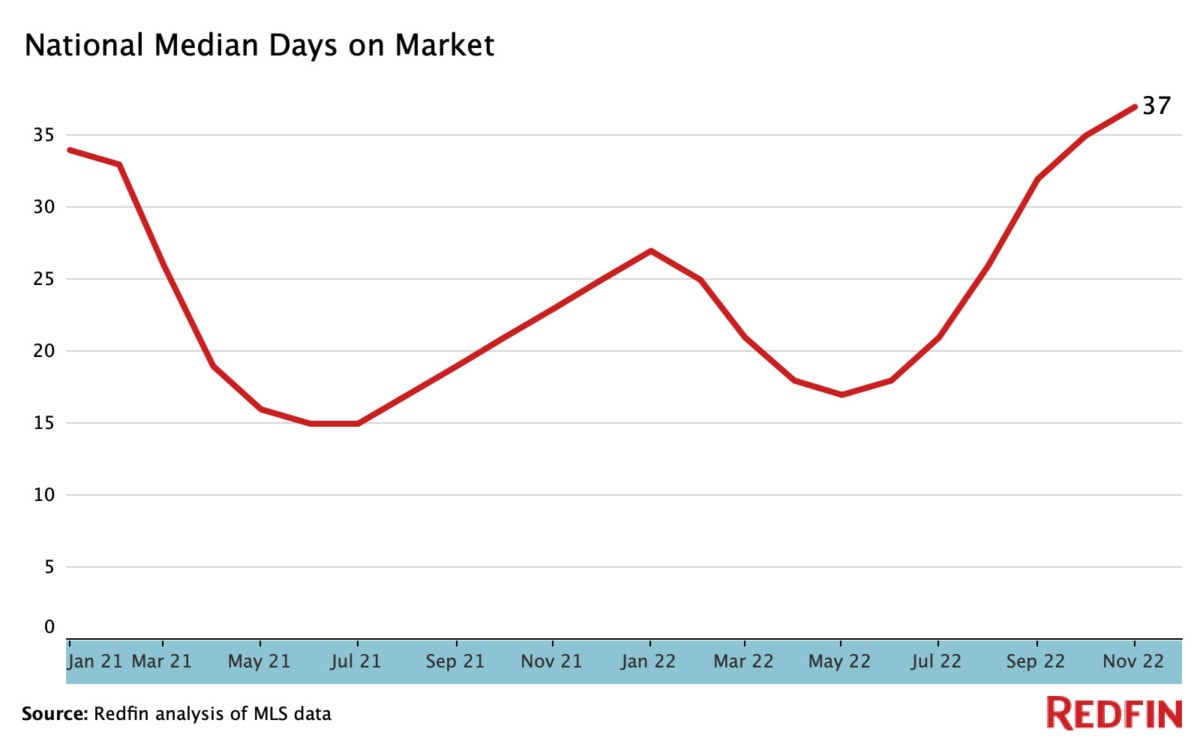
12. Median days on market rose at a record pace, signaling a dramatic turnaround from 2021’s breakneck pace
In 2022, homes spent an average of just 24 days on the market, an 8.4% increase year over year compared to the 22 days on the market in 2021. Since 2020, a housing supply crunch has been caused by supply chain issues, a chronic lack of homebuilding, and an increase in demand. In 2022, time on the market ticked up as homebuilding began to catch up to demand and high mortgage and inflation rates limited buyers’ spending power.
“Due to a slowing economy and layoffs in the tech sector near the end of the year, many buyers paused their home search due to affordability and job security,” notes Frank Vettese III, a San Francisco Redfin agent. “This was one of many factors that contributed to the dramatic slowdown in sales.”
- May was the busiest month of the year, with homes spending an average of just 17 days on the market.
- In the four weeks ending December 4th, homes spent an average of 37 days on the market, the slowest month of 2022 and the biggest year-over-year slowdown on record.
13. 14% of active home listings experienced price drops
On average, 14% of active homes for sale had price drops in 2022, up 4.7% year over year. In October, 22.6% of listings had price drops, a decades-long high. In fact, from February through July, the number of homes with price drops rose from 5.7% to 19.5%, a record-fast increase. “The shift was dramatic,” says Christy Beach, a Seattle-area Redfin agent. “The buyers who didn’t secure a home during the height of competition are now bidding low. For example, the same type of home that buyers were willing to offer $200,000 over list price are now offering $200,000 below list price.”
- In Denver, 47% of homes experienced reductions in price, the highest percentage of any major city.
- Even though price drops were common, median sale prices still increased in almost every metro in the county.
- Many pandemic-era migration hotspots, such as Tampa, Las Vegas, and West Palm Beach, had a large percentage of listings with price drops as well.
“As sellers with stale listings became increasingly anxious to get their properties sold, we saw a steep rise in price drops through the summer here in Washington State,” says Darlene Heseltine, a Tacoma, WA Redfin agent. “Currently, homes that are fresh on the market are starting to move more quickly. As mortgage rates dip further, in-demand properties may start receiving multiple offers.”
The top five cities with the highest share of price drops in 2022
Data includes the median price drops out of all active listings in each of the 50 largest metropolitan areas.
14. 55% of homes had a bidding war
55% of homes had bidding wars in 2022, down from 64% in 2021. Coastal metros experienced the highest rates of bidding wars, including Boston (69.8%) and Los Angeles (67.7%).
However, nationwide, bidding wars fell from 72% to 35% from February to November. A worsening economy, higher mortgage rates, and an increase in supply contributed to the slowdown.
Shauna Pendleton, a Boise, ID Redfin agent, advises sellers to be patient and wait for mortgage rates to drop. “Unless a home is priced $100,000 or more under market value, bidding wars are mostly non-existent. Our team still hears of a few multiple-offer situations; in these cases, it’s typically a luxury home in a high-demand neighborhood that is priced very aggressively.”
The top five metros with the highest percentage of bidding wars in 2022
Data includes the median percentage of bidding wars across active listings in each of the 50 largest metropolitan areas.
15. Over 30% of homes were purchased with cash in 2022
30.7% of homes were purchased with all cash, up 2% year over year. In October (the most recent data available), 32% of homes were paid for with all cash, up 2% year over year and the highest share since 2014.
- Florida was the most popular state for all-cash purchases, especially Jacksonville and West Palm Beach.
- Expensive west coast metros, including Oakland, San Jose, and Seattle, had the lowest share of all-cash purchases.
Data is from a Redfin analysis of county records across 39 of the most populous U.S. metropolitan areas, dating back through 2011. Data does not include November or December.
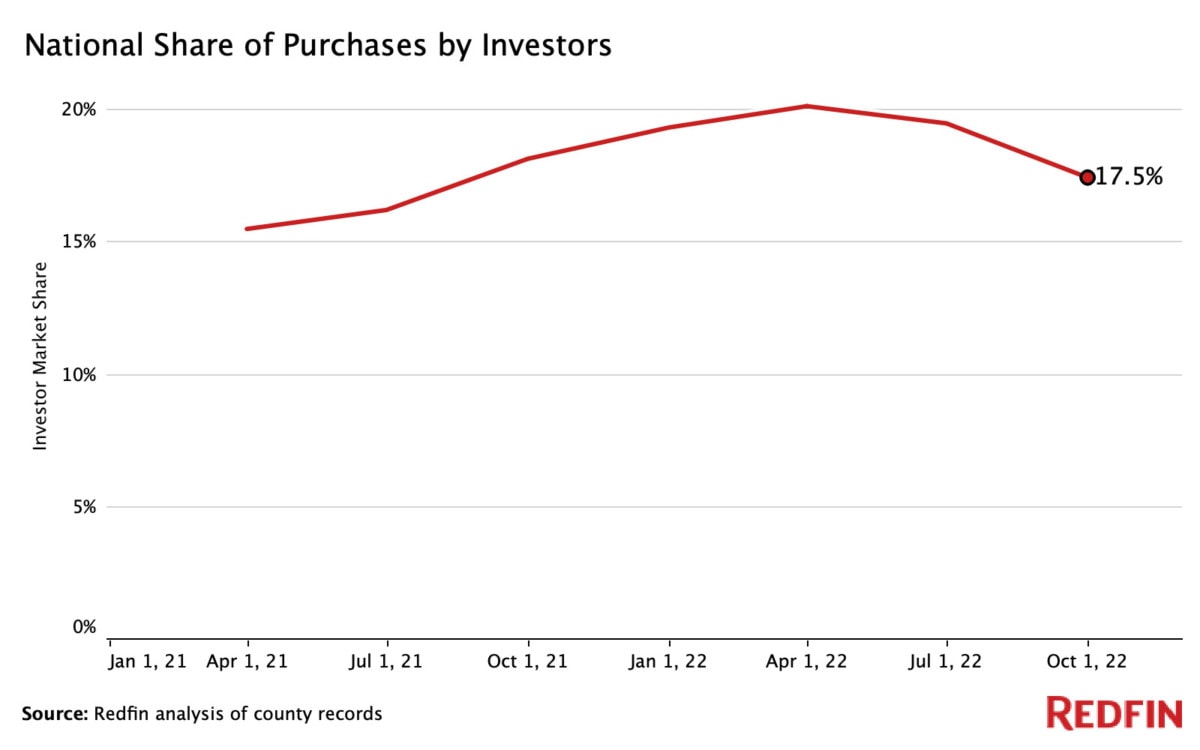
16. Real estate investors purchased nearly 20% of available listings, a new record
Vying to capitalize on the housing and rental boom, investors purchased 233,701 homes in 2022 through September, a record-breaking 19.1% of all listings. Multifamily residential properties constituted the largest percentage of investor market share, with an average of 30% of these properties being purchased by investors.
Pandemic boomtowns became the largest investor hotspots, especially in Sun-Belt metros.
The top five metros with the largest investor market shares in 2022
Data is analyzed on a quarterly basis and includes all property types unless otherwise stated. Total percentage is the average of data from January-September. Data does not include the last quarter of 2022.
17. Luxury home sales experienced their biggest year-over-year decline on record
In 2022, there were 258,733 luxury homes sold in the U.S., down 27% year over year and the biggest decline since 2012. Active listings dropped even further, falling by 32.7% year over year. The median sale price for a luxury home was $1,080,000, up 14.8% year over year. Prices reached their peak of $1,120,000 during the three months ending May, a 15.7% year-over-year increase. However, price growth, listings, and sales slowed significantly as demand cooled later in the year.
- In the three months ending November 30th, luxury home sales fell by 38.1%, the largest drop on record.
- Luxury homes spent an average of 32 days on the market through November, up 28.9% year over year
- Tampa was the fastest growing luxury market, with prices rising by 32.3% year over year
- Luxury home sales declined by 47% in San Jose, the biggest fall of any major metro
“In Seattle, luxury listings saw the largest reductions in price,” continues Seattle agent Christy Beach. “In the current market, most sellers with a price point of $1.5 million or higher need to prepare to make their home stand out among the competition. More often than not, sellers are having to negotiate their price and terms with buyers.”
Luxury homes are defined as the top 5% of listings in a given market. Values are three month moving aggregates ending on the date shown, e.g., November 2022 spans September, October, and November 2022. Data does not include the three months ending December 31.
Looking forward
The 2022 housing market was chaotic, but what does Redfin predict for 2023? Read our 2023 Housing Market Predictions to learn more.
All data was compiled by the week ending December 23, 2022. Data is aggregated from January to November and does not include December unless stated otherwise. All data is from Redfin, FRED, and/or public records. For questions about metrics, read our metrics definitions page.

It’s no secret that real estate can be a lucrative investment. But how do you know which house to buy, or better yet, what city you should buy it in? While there may be arguments for many attractive cities based on recent growth or fluctuations in housing prices, college towns are consistently some of the best places to buy investment properties in the U.S.
Demand for rental properties in college towns remains high due to steady demand. From new students to university faculty coming in each year, you’ll never find yourself scrambling to rent out your place. College towns also make great locations for BnB-type rental properties as visitors tend to flock to college towns during sports seasons and friends or relatives of students often visit and need a place to stay.
Which college town is right for you for a future investment property? To help you decide, we ranked college towns across the U.S. by affordability, walking distance to amenities, and the level of high-quality education relative to low tuition and fees.
1. Binghamton, NY – Binghamton University – SUNY
Median List Price: $119,000
Tuition and Fees: $24,488
U.S. News and World Report Ranking: 80
Walk Score: 55
2. Syracuse, NY – SUNY College of Environmental Science and Forestry and Syracuse University
Median List Price: $118,000
Tuition and Fees: $18,218 (SUNY ESF) and $51,853 (Syracuse University)
U.S. News and World Report Ranking: 118 (SUNY ESF) and 53 (Syracuse University)
Walk Score: 61
3. Buffalo, NY – University of Buffalo
Median List Price: $155,000
Tuition and Fees: $27,758
U.S. News and World Report Ranking: 89
Walk Score: 68
4. Gainesville, FL – University of Florida
Median List Price: $235,500
Tuition and Fees: $28,658
U.S. News and World Report Ranking: 35
Walk Score: 34
5. Athens, GA – University of Georgia
Median List Price: $205,000
Tuition and Fees: $30,404
U.S. News and World Report Ranking: 46
Walk Score: 46
6. Champaign, IL – University of Illinois Urbana-Champaign
Median List Price: $194,000
Tuition and Fees: 32,568
U.S. News and World Report Ranking: 46
Walk Score: 50
7. Baltimore, MD – John Hopkins University
Median List Price: $190,000
Tuition and Fees: $53,740
U.S. News and World Report Ranking: 10
Walk Score: 69
8. Tallahassee, FL – Florida State University
Median List Price: $237,700
Tuition and Fees: $21,673
U.S. News and World Report Ranking: 70
Walk Score: 32
9. Cleveland, OH – Case Western Reserve University
Median List Price: $89,900
Tuition and Fees: $49,042
U.S. News and World Report Ranking: 42
Walk Score: 60
10. St Louis, MO – Washington University in St. Louis
Median List Price: $170,000
Tuition and Fees: 53,399
U.S. News and World Report Ranking: 19
Walk Score: 65
11. Columbus, OH – Ohio State University – Columbus
Median List Price: $215,000
Tuition and Fees: $29,659
U.S. News and World Report Ranking: 56
Walk Score: 41
12. Pittsburgh, PA – University of Pittsburgh and Carnegie Mellon University
Median List Price: $200,000
Tuition and Fees: $32,052 (University of Pittsburgh) and $55,465 (Carnegie Mellon)
U.S. News and World Report Ranking: 70 (University of Pittsburgh) and 25 (Carnegie Mellon)
Walk Score: 62
13. Rochester, NY – University of Rochester
Median List Price: $139,000
Tuition and Fees: $53,926
U.S. News and World Report Ranking: 33
Walk Score: 65
14. New Haven, CT – Yale University
Median List Price: $225,000
Tuition and Fees: $53,430
U.S. News and World Report Ranking: 3
Walk Score: 68
15. Provo, UT – Brigham Young University – Provo
Median List Price: $318,000
Tuition and Fees: $5,620
U.S. News and World Report Ranking: 66
Walk Score: 47
16. West Lafayette, IN – Purdue University – West Lafayette
Median List Price: $264,900
Tuition and Fees: $28,804
U.S. News and World Report Ranking: 56
Walk Score: 50
17. Philadelphia, PA – Temple University and the University of Pennsylvania
Median List Price: $245,000
Tuition and Fees: $28,426 (Temple University) and $55,584 (University of Pennsylvania)
U.S. News and World Report Ranking: 106 (Temple University) and 8 (Pennsylvania)
Walk Score: 79
18. Troy, NY – Rensselaer Polytechnic Institute
Median List Price: $134,000
Tuition and Fees: $53,880
U.S. News and World Report Ranking: 49
Walk Score: 55
19. Albany, NY – University of Albany – SUNY
Median List Price: $218,000
Tuition and Fees: $24,436
U.S. News and World Report Ranking: 140
Walk Score: 65
20. Lawrence, KS – University of Kansas
Median List Price: $169,000
Tuition and Fees: $27,358
U.S. News and World Report Ranking: 129
Walk Score: 40
Methodology:
Only the top 200 schools in the U.S. News and World Report National Universities Rankings list were considered. We used their rankings as well as their tuition and fees cost information. We then only considered locations with median list prices under $550,000. Tuition and fees, U.S. News and World Report ranking, and median list prices were all weighted equally (.3), with Walk Score weighted less than these categories (.1).
Having a home away from home is a dream for many Americans—and for a lot of us that dream includes a quick walk to the beach and all the amenities you can only find on a boardwalk.
While many beloved beach towns like Key West, Florida and Santa Monica, California are out of reach for the typical homebuyer, with median prices in the millions, affordable beach towns do exist. In Florida alone there are seven coastal cities where the median home price is less than $280,000.
To help you achieve your beach house dreams, we’ve rounded up the 15 most affordable beach towns in the U.S. and chatted with Redfin real estate agents about what makes each unique. At these prices, you’ll have your toes in the sand in no time!
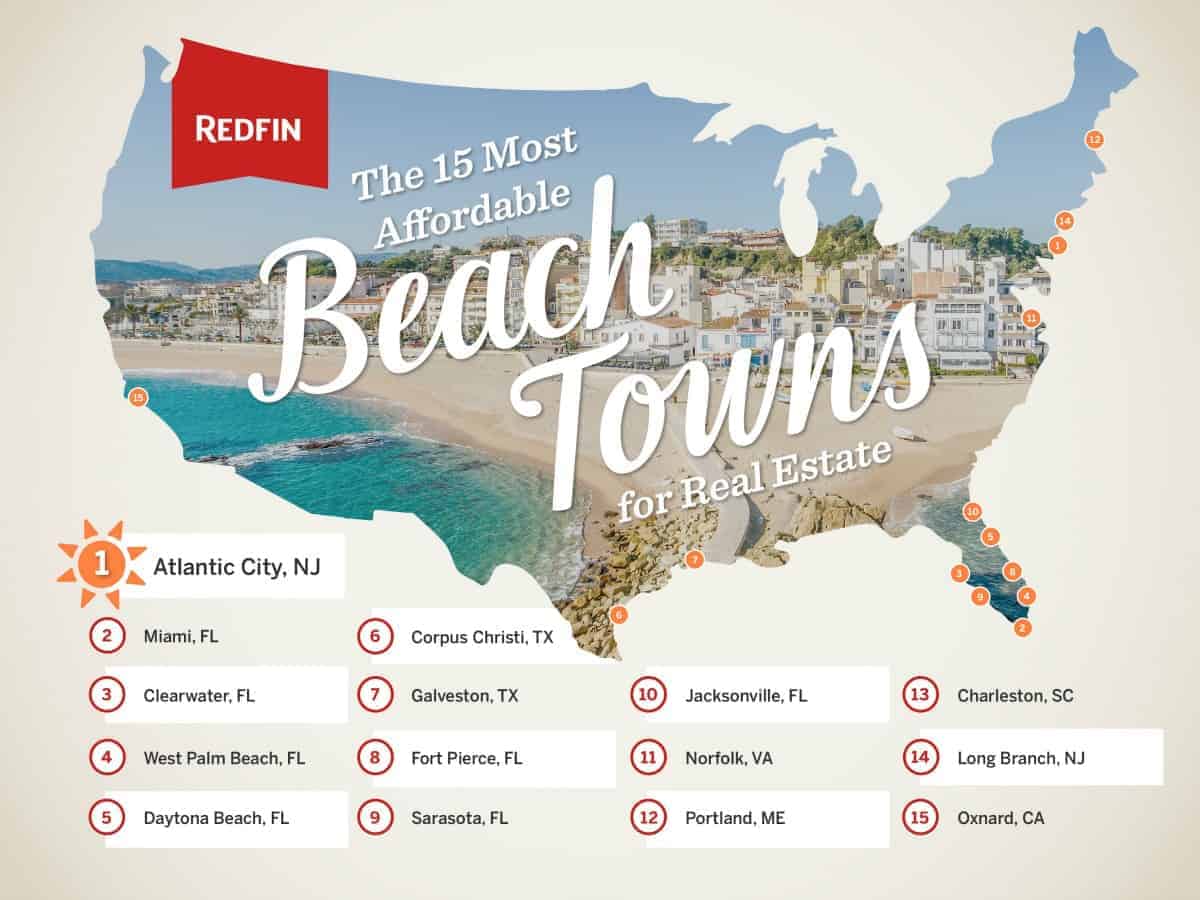
1. Atlantic City, NJ
Median Sale Price: $52,250
WalkScore: 72
Portion of Homes Waterfront: 27.6%
“Atlantic City and its surrounding beach towns have so much to offer someone looking for a vacation home,” said Redfin real estate agent Kimberly Mogan. “Not only does Atlantic City boast some of the finest beaches on the east coast, including an iconic boardwalk, the town offers glitzy nightlife, beautiful casinos, restaurants and an impressive lineup of year-round events. It’s a perfect home away from home for someone who thrives in an action-packed city.”
2. Miami, FL
Median Sale Price: $275,000
WalkScore: 78
Portion of Homes Waterfront: 11.7%
“Many of my clients end up buying a second home in Miami,” said Redfin real estate agent Jose Medina. “The year-round warm weather is what gets them to visit Miami the first time, but once here they quickly fall in love with what Miami is best know for: The beaches, the culture, the lifestyle.
Miami is an emerging city with something for everyone. On the streets of Brickell (Miami’s financial district) you’ll experience a New York-type hustle and bustle. If it’s music you love, downtown Miami offers the yearly Ultra Music Festival in Bayfront Park. Golfers can lay back and play 18 holes of Golf in a PGA golf course. And, of course, there are the incredible beaches.”
3. Clearwater, FL
Median Sale Price: $174,250
WalkScore: 43
Portion of Homes Waterfront: 19%
Clearwater, a city in Florida’s Tampa Bay area, is a year-round destination with entertainment for visitors and residents on any budget.
“Two things Clearwater offers in abundance are beautiful beaches and small-town charm,” said Redfin real estate agent Starlet Jordan. “Caladesi Island, which is less than 10 minutes north of Clearwater, has been recognized as one of the nation’s best beaches. There is also a beautiful beach resort called San Pearl and several new luxury hotels with amazing waterfront restaurants. Check out Clearwater Marine Aquarium where you’ll find Winter the Dolphin, star of the movie Dolphin Tale!”
4. West Palm Beach, FL
Median Sale Price: $170,000
WalkScore: 41
Portion of Homes Waterfront: 28%
“West Palm Beach offers a Key West-style of living, but in the financial district of downtown. You can find everything from high-rise condos to single-family homes in all price points,” said Redfin real estate agent Delray Valle.
“West Palm is know for Clematis Street, which is the historical heart of downtown and features night clubs, live music, boutiques, historical landmarks and incredible restaurants. Outside of having beautiful white sandy beaches, there is entertainment galore in West Palm Beach. There’s the Kravis Center, which is where Broadway shows hit south Florida; City Place, which is known for outside dining, mall shopping and a variety of museums and art; and private golf country clubs, as well as yachting clubs. West Palm Beach also has the only drive-through safari in the United States, called Lion Country Safari. The animals walk around your car freely as you drive through! Another attraction is Worth Ave., which is home to designer and high-end retail shops. Finally, Florida doesn’t have state taxes, so everyone loves that!”
5. Daytona Beach, FL
Median Sale Price: $136,000
WalkScore: 36
Portion of Homes Waterfront: 37%
“About half of my closings this year have been from out of state buyers,” said Redfin real estate agent Tim Harper. “The main appeal of the Daytona Beach area, which sits between Port Orange and Ormond Beach, is our beautiful beach that runs about 20 miles long. Nationally speaking, we are one of the more affordable coastal areas and we’re on people’s radar for that reason. The home values are on the rise and the growth of commercial building has increased greatly with The Hard Rock, Latitude Margaritaville and Tanger Outlet Mall all going up recently. The warm climate and the proximity to Jacksonville and Orlando are great perks as well.”
6. Corpus Christi, TX
Median Sale Price: $240,000
WalkScore: 39
Portion of Homes Waterfront: 11.2%
“Corpus Christi offers lots affordable beach-front and canal-front homes,” said Redfin real estate agent Cindy Kranzel. “One of my clients recently told me they wanted a vacation home in Corpus Christi because the people here are ‘so friendly.’ It’s also a great place for a second home because of the extended rental season; Texas retirees and business owners looking to escape the snow flock here in the winter. Attractions in Corpus Christi include USS Lexington tours, the Texas State Aquarium, horseback riding tours on the beach, the Selena Museum and more.”
7. Galveston, TX
Median Sale Price: $224,000
WalkScore: 50
Portion of Homes Waterfront: 22.3%
“Galveston’s glistening beaches, quaint historic downtown shops on The Strand and beautiful East End Victorian homes are enough to make anyone want to vacation here,” said Redfin real estate agent Angela Pachicano. “But the island also offers a multitude of museums and live music. No matter what month you visit, there is always something to do—from movie nights to sand castle competitions to princess day on the beach!”
8. Fort Pierce, FL
Median Sale Price: $155,000
WalkScore: 38
Portion of Homes Waterfront: 32%
Fort Pierce, Florida is known by locals as the “sunrise city”, and for good reason! It offers sandy beaches, restaurants, charter boats and clear views of the water. You can interact with marine life at one of the many research facilities or museums that care for endangered manatees, dolphins and coral reefs. Also popular is the historical National Navy UDT-SEAL Museum, established in honor of those who trained in Fort Pierce during World War II. With a median sale price of just $155,000, it’s one of the most affordable beach towns on our list.
9. Sarasota, FL
Median Sale Price: $260,000
WalkScore: 52
Portion of Homes Waterfront: 17.5%
“Sarasota offers an impressive mix of culture and waterfront lifestyle that I find to be really unique and difficult to find all in one place,” said Redfin agent Brian Walsh. “From the quaint downtown strip of shops and boutiques to the equally charming St. Armand’s circle, the whole area is just as varied and engaging as anyone could hope. The pace is certainly more southern than northern, but when you’re just a few minutes from some of the world’s most famous beaches that’s sort of expected.
I also love the shopping and art scene in Sarasota. I think the blend of city culture and beach leisure is what really makes it a great place to find a vacation home. You can enjoy the solitude of a book on the beach and then run to UTC for some shopping. Sarasota has personality in every direction.”
10. Jacksonville, FL
Median Sale Price: $168,000
WalkScore: 26.2
Portion of Homes Waterfront: 15.2%
“Miles of beautiful, easily accessible beaches and abundant outdoor activities draw people to Jacksonville,” said Redfin real estate agent Wendy Seidel. “There are also great museums, festivals, sporting events, concerts and farmers markets throughout the year. Jacksonville is within close proximity to historic St. Augustine and an easy drive to Savannah, Atlanta, Charleston and the Florida Keys. The downtown area is being revitalized with new restaurants and shops. It’s a great place to buy a vacation home right now!”
11. Norfolk, VA
Median Sale Price: $179,900
WalkScore: 44.6
Portion of Homes Waterfront: 11.2%
Norfolk, VA is home to beautiful waterfront views, boardwalks and other local amenities great for families. Virginia’s most-populated city, Virginia Beach, sits close by as a great resource for entertainment, food and outdoor activities: on the water, in town or in the park. The beach town-feel provides an inviting atmosphere that’s comfortable and accommodating for all age groups.
12. Portland, ME
Median Sale Price: $279,000
WalkScore: 60
Portion of Homes Waterfront: 6.7%
“The Portland area boasts miles of sandy beaches, seaside state parks, breathtaking harbor and ocean views and picture-perfect sailing waterways, all within minutes of downtown Portland,” said Redfin real estate agent Van Wilkerson. “The Portland Headlight lighthouse is a popular summertime destination, as are the Old Port shopping district and excursions on or from Casco Bay. Portland is nationally renowned for its fine dining and craft brewery scenes, recognized by Bon Apetit magazine, the New York Times and many more in recent years as a top food and beverage destination. Seafood caught fresh off the coast and prepared daily by innovative chefs is the mainstay of Portland’s culinary appeal.
The Portland Arts District houses world-class museums, art galleries, antique shops and artist studios, as well as multiple performance spaces. A self-guided walking tour of the district takes place on the first Friday evening of each month when all galleries, museums and local businesses open their doors to the public. Recently voted one of the Greenest Small Cities, Portland and surrounding towns have 11 professional golf courses, 124 tennis courts, 95 playgrounds and acres of parks and nature trails. A popular farm-to-table destination, local growers supply organic meats and produce to Portland restaurants, supermarkets and neighborhood grocery stores.”
13. Charleston, SC
Median Sale Price: $278,625
WalkScore: 39
Portion of Homes Waterfront: 6.1
“Charleston is full of southern charm and fun things to do,” said Redfin real estate agent Michael Dalnekoff. “You can find festivals for just about anything. Right now, we have the internationally recognized Spoleto Festival going on. For 17 days, historic theaters, churches and outdoor spaces in Charleston are filled with performances by artists and performers in opera, dance, theater and more.
Charleston is also a foodie heaven. Downtown offers lots of walkable restaurants and bars. For the outdoors lover, there is tons of recreation, including beaches, golf, marshlands and wildlife preserves. There are historic carriage rides and many historic preserved plantations for the history buff. No matter what you’re interested in, Charleston is a great place for a second home.”
14. Long Branch, NJ
Median Sale Price: $332,500
WalkScore: 62
Portion of Homes Waterfront: 17%
Long Branch was once known as the Hollywood of the East Coast, where many acclaimed actors and actresses gathered and performed. By it’s current residents, it is often regarded as a “hidden gem.” In addition to a great public beach, Long Branch offers a wide variety of annual events and activities including free outdoor concerts, boardwalk workouts, free movies at the pier and more. Long Branch is home to the Seven Presidents Oceanfront Park, which was named for the seven U.S. presidents who visited the town.
15. Oxnard, CA
Median Sale Price: $450,000
WalkScore: 53
Portion of Homes Waterfront: 5.1%
If your beach home dreams include the Pacific Ocean and a quick drive to Los Angeles, Oxnard is the city for you. Oxnard is 60 miles northwest of Los Angeles, and offers beautiful weather, a myriad of outdoor recreation opportunities and miles of uncrowded beaches. Farmers markets, festivals, concerts and museums will keep you busy when you’re not hitting the beach.
Methodology:
Redfin looked at coastal cities with populations of at least 1,000 people and identified those where at least 3 percent of the vacant units were flagged by the Census as being for seasonal use to define “vacation cities.” The cities also had to have a median price per square foot of under $300 and a median sale price under $1 million. We then ranked each of the places by an equal combination of the following five factors:
- Price per square foot during the first three months of 2017
- Portion of properties on waterfront (using previous 3 years of listings)
- Percent of properties flagged for seasonal use by the Census
- Population (larger cities rank better)
- Walk Score
Want to start searching for a vacation home? Reach out to a Redfin agent below!