

A slight drop in mortgage rates coming into 2024 slowed winter home price declines
Mortgage rates dropped as 2024 began, leading to high housing market expectations. Nevertheless, with rates creeping up since the year started, the spring homebuying season is off to a weaker start than many had hoped for.
But signs of a thawing housing market are clear, especially when examining the availability of existing for-sale inventory, with new listings finally showing positive increases on an annual basis in recent months. And while more new listings give homebuyers more options, additional inventory could also prevent the home price spiral seen in the spring of 2023, particularly if mortgage rates decline further. Still, despite the expected slowing of home price growth in 2024, CoreLogic’s Home Price Index (HPI) forecasts another year of gains averaging about 3.2% for the year.
In January, the CoreLogic S&P Case-Shiller Index rose by 6% year over year, the seventh consecutive month of annual increases following two months of annual declines (Figure 1). With the rebound in appreciation in 2023, home prices are now up by 1% compared with the June 2022 peak and up by 6% from January 2023, when they bottomed out.
High mortgage rates continued to impact monthly price gains in January, with the non-seasonally adjusted month-over-month index declining for the third time since January 2023, down by 0.1% in January compared with the seasonally adjusted no change recorded on average between 2015 and 2019 (Figure 2). The January monthly decline is smaller than the 0.4% decline recorded in December and the 0.3% decrease seen in November.
The 10-city and 20-city composite indexes posted the seventh straight month of annual increases in January, up by 7.4% and 6.6%, respectively, the same increase since the January 2023 bottom. The 10-city index includes currently better-performing metro areas such as New York and Chicago, which have seen relatively stronger housing markets since mid-2022, as the return to cities and offices continues. Many of these metros are catching up on home prices gains that pandemic-era boomtowns experienced during COVID-19.
Among the top 100 largest metro areas, the five with the highest rate of home price appreciation this year are in Northeast, with most surrounding New York City, including Camden, New Jersey (up by 13%); Hartford, Connecticut (up by 13%) and Newark, New Jersey (up by 11%).
Compared with the 2006 peak, the 10-city composite index is now 47% higher, while the 20-city composite is up by 54%. Adjusted for inflation, which is showing signs of easing, the 10-city index is now 1% higher than its 2006 level, while the 20-city index is up by 5% compared with its 2006 high point. Nationally, home prices are 15% higher (adjusted for inflation) compared with 2006.

© 2024 CoreLogic,Inc., All rights reserved.

© 2024 CoreLogic,Inc., All rights reserved.
In January, 14 metros saw faster price growth year over year compared with the previous month (Figure 3). Acceleration in annual gains continues to reflect a comparison with the home price bottom in January 2023.
San Diego, Los Angeles and Detroit continued to lead the 20-city index, with respective annual gains of 11.2%, 8.6% and 8.2%. Eleven metros saw annual prices gains higher than the national 6% increase.
The strongest annual price acceleration compared with the previous month was again seen in the Western U.S., particularly in San Diego, Seattle, San Francisco and Las Vegas.
On the other hand, while still showing annual gains, Cleveland, Boston and Miami reported slowing appreciation in January. Portland, Oregon saw the slowest rate of home price gains, up by 1% compared with January 2023.

© 2024 CoreLogic,Inc., All rights reserved.
While home prices declined by 0.1% nationally from December to January, regional variances continued. Figure 4 summarizes the current year’s monthly changes in January compared with averages recorded between 2015 and 2019.
San Diego and Washington posted the nation’s largest monthly gains, a respective 1.8% and 0.5%. Metros in the Midwest, including Cleveland, Detroit, Minneapolis and Chicago, which saw strength in home price growth in recent months, cooled off in January. In general, while high mortgage rates at the end of 2023 had an increasingly dampening impact on home prices by the end of the year, more affordable Midwestern metros continued to struggle with affordability challenges as mortgage rates remained elevated.
And while all metros except for San Diego, Washington and Los Angeles posted monthly declines, decreases were relatively stronger in Cleveland and Denver in January compared with trends in monthly changes seen prior to the pandemic (Figure 4).

© 2024 CoreLogic,Inc., All rights reserved.
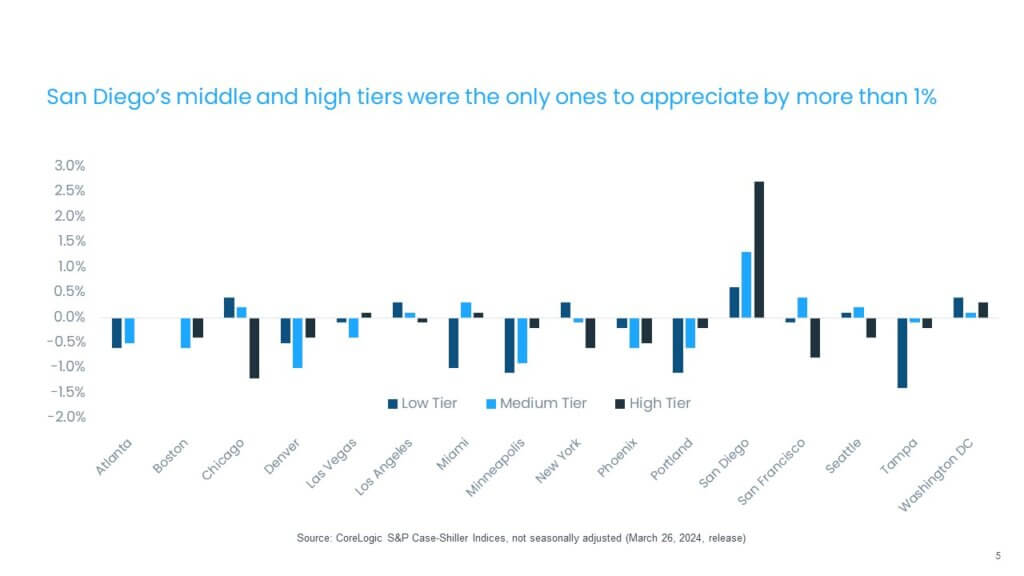
The month-over-month comparison of appreciation by price tier and location also reveals relative changes in demand across the country. In January, most metros and price tiers saw home prices fall, except for the exceptionally strong gains seen in San Diego, particularly in the high tier. The largest slowdowns were in the low tier in Tampa, Florida; Portland; Minneapolis and Miami. All tiers on average saw price declines (Figure 5).
© 2024 CoreLogic,Inc., All rights reserved.
While the S&P CoreLogic Case-Shiller Index continues to show home price resiliency in the wake of surging borrowing costs, it also highlights continued headwinds for the housing market, namely affordability challenges for potential homebuyers due to rising home prices and elevated mortgage rates. Also, the slowing of gains in some affordable regions reflects greater sensitivity to higher homeownership costs in those areas. But improvement in the availability of new listings is a welcome change, which may help relieve some pressure on home prices going forward.


Home prices in San Diego declined again in December, but the metro area led the top 20 U.S. cities in appreciation last year, according to the authoritative Case Shiller Index released Tuesday.
Prices fell 0.8% in December, 0.4% in November and 0.1% in October, but remained 8.8% higher than in December 2022.
“San Diego reported the highest year-over-year gain among the 20 cities with an 8.8% increase in December, followed by Los Angeles and Detroit, each with an 8.3% increase,” according to the report.
Brian D. Luke of S&P Dow Jones Indices blamed the recent trend of falling prices on increased borrowing costs.
“Increased financing costs appeared to precipitate home price declines in the fourth quarter, as 15 markets saw lower values compared to September,” he said.
The San Diego figures compared to an average 0.4% decline nationwide in December and an average 5.5% increase for the entire year.
Luke said that 2023 proved to be an exceptional year for the nation’s housing market.
“Looking back at the year, 2023 appears to have exceeded average annual home price gains over the past 35 years,” he said.

After nine months of steadily increasing housing prices in the U.S., price growth has now decreased for the second month in a row.
Housing prices were on the rise for a long stretch of nine months in 2023 — until November. That month’s small drop of 0.2 percent continued into December: S&P CoreLogic’s latest Case-Shiller U.S. National Home Price NSA Index, released February 27, 2024, reports that home-price growth dropped in December 2023 by 0.4 percent. In fact, 17 of the 20 major metro markets measured by Case-Shiller reported month-over-month price decreases.
Case-Shiller Index still up compared to last year
While the month-over-month numbers show a slight decrease, the index is still up by 5.5 percent from last December. The 10- and 20-city composites each also rose year-over-year, by 7.0 percent and and 6.1 percent respectively.
“U.S. home prices faced significant headwinds in the fourth quarter of 2023,” said Brian D. Luke, head of commodities, real & digital assets at S&P DJI, in a statement. “However, on a seasonally adjusted basis, the S&P Case-Shiller Home Price Indices continued its streak of seven consecutive record highs in 2023. Looking back at the year, 2023 appears to have exceeded average annual home price gains over the past 35 years.”
Regional fluctuation continues
“All 20 markets reported yearly gains for the first time this year,” Luke said, with 10 of 20 markets beating prior records in December. San Diego led the pack with an 8.8 percent year-over-year increase, followed by an 8.3 percent gain in both Los Angeles and Detroit. The next highest gains were reported in Chicago, up 8.1 percent, and Charlotte, up an even 8 percent. Despite the top-performing market being in the West, the Midwest and Northeast were the best-performing regions with 6.7 percent gains each.
The Fed and the housing market
The Federal Reserve’s aggressive moves to combat inflation — with 10 consecutive rate hikes over 2022 and 2023 — have put upward pressure on mortgage rates. While the Fed doesn’t directly set mortgage rates, the mortgage market’s interpretations of the central bank’s moves influence how much you pay for your home loan.
The long period of low mortgage rates following the Great Recession came to an end in 2022. In June 2022, rates topped 6 percent for the first time since 2008. The upward trend continued through October, when rates hit a 23-year high of 8 percent. “The house price decline came at a time where mortgage rates peaked,” Luke noted last month.
Steve Reich, division president at Go Mortgage in Pennsylvania, highlights the impacts that these trends have on the housing market. “As the Fed worked to get inflation under control, higher interest rates tempered what many homebuyers could afford and, in turn, softened home sales,” he said in a statement.
Higher rates also exacerbate the housing shortage, stopping many homeowners from selling when they otherwise might — and thus keeping those homes off the market and out of the supply of available housing.
— Mark Hamrick, Bankrate Senior Economic Analyst
“The remarkable rise in mortgage rates is acting as a kind of golden handcuffs,” says Mark Hamrick, Bankrate’s senior economic analyst. Higher rates are “limiting the desire and some of the ability of people to move out of the homes they currently own. That further pressures housing inventory, adding insult to supply injury.”
However, rates have begun trending back downward. As of February 21, 2024, the average 30-year mortgage rate sat at 7.13 percent.
What it means for homebuyers and sellers
The current market has proved challenging on both sides of the real estate transaction — and unless we see a significant drop in either home prices or mortgage rates, both buyers and sellers will need to go with the flow. “For prospective sellers, the new status quo dictates they remain flexible on price, given the extraordinary challenges posed by the sharp increase in mortgage rates,” Hamrick says.
“Those who are very motivated to purchase a home should be prepared for the sticker shock associated with the increased expense of financing the purchase,” he continues. “Part of the flexibility that may be required includes seeking a possible downgrade of footprint or quality of home, along with the neighborhood, in order to achieve an affordable purchase.”
Both buyers and sellers will want to keep a very close eye on mortgage rates in the coming months. “With home prices edging down for both the fourth quarter and December, it seems increases may have crested for now,” said Robert Frick, corporate economist with Navy Federal Credit Union. However, he continued, “If mortgage rates dip this year as expected, price increases may again revive as home demand improves.”
Reich emphasizes that buying a home in today’s market, while difficult, is still possible. “The average time active listings stay on the market is getting longer, resulting in a slightly less competitive market,” he says. National Association of Realtors data proves that out: The median days-on-market length was 36 days in January, up both month-over-month and year-over-year, which gives buyers more time to make an informed, well-considered decision. “And that’s good news for homebuyers who are still in the game.”

High mortgage rates at the end of 2023 continued to dampen monthly appreciation in December, pulling prices down by 0.4% from November
With a full year of data on record as of December 2023, the CoreLogic S&P Case-Shiller Index again indicated the resiliency of home prices against surging borrowing costs and historic housing supply shortages. In 2023, home prices increased by 2.4% compared with 2022, when gains averaged 14.8% for the year. Between 2014 and 2019, home price growth averaged 5.2%.
In December, the CoreLogic S&P Case-Shiller Index rose by 5.5% year over year, the sixth month of annual increases following two months of annual declines (Figure 1). With the rebound in appreciation in 2023, home prices are now up by 0.6% compared with the June 2022 peak and up by 6.1% from the January 2023 bottom.
While prospects for 2024 housing market activity looked promising coming into the year, elevated mortgage rates, which recently took another step higher, are posing a challenge for both buyers and sellers. With early data for the supply of homes for sale and contracts signed in January and February, the expected 2024 rebound has yet to be seen, particularly as the spring homebuying season nears. But despite constrained sales activity, home prices are expected to moderate as the imbalance between buyers and sellers continues. The latest CoreLogic Home Price Index (HPI) forecast estimates that home prices will increase by another 3% on average in 2024.
High mortgage rates continued to impact monthly price gains in December, with the non-seasonally adjusted month-over-month index declining for the second time since January 2023, down by 0.4% in December, compared with the seasonally adjusted no change recorded on average between 2015 and 2019 (Figure 2).
The 10-city and 20-city composite indexes posted six months of annual increases in December, up by 7% and 6.1%, respectively. Both indexes are also up by 7.4% and 6.7%, respectively, since the beginning of 2023. The 10-city index includes currently better-performing metro areas such as New York and Chicago, which have seen relatively stronger housing markets since mid-2022, as the return to cities and offices continues. Many of these metros are catching up on home prices gains that pandemic-era boomtowns experienced during COVID-19. The metros with the strongest gains since the beginning of 2023 include San Diego, (up by 9.9%), Detroit (up by 9.1%) and Chicago (up by 8.6%).
Compared with the 2006 peak, the 10-city composite index is now 47% higher, while the 20-city composite is up by 54%. Adjusted for inflation, which is showing signs of easing, the 10-city index is now 1% higher than its 2006 level, while the 20-city index is up by 5% compared with its 2006 high point. Nationally, home prices are 15% higher (adjusted for inflation) compared with 2006.

© 2024 CoreLogic,Inc., All rights reserved.

© 2024 CoreLogic,Inc., All rights reserved.
In December, all metros saw faster price growth year over year compared with the prior month (Figure 3). Acceleration in annual gains mostly reflects declining prices seen in December of 2022.
San Diego (up by 8.8%) and Los Angeles and Detroit (both up by 8.3%) now lead the 20-city index. These metros are followed by Chicago and Charlotte, North Carolina, up by 8.1% and 8%, respectively.
However, the strongest month-over-month price acceleration was again seen in the Western U.S., particularly in Las Vegas, Phoenix, Seattle and Los Angeles. And while no metros posted slowing annual gains, Minneapolis, Detroit and Boston showed almost no change in year-over-year increases compared with the previous month.

© 2024 CoreLogic,Inc., All rights reserved.
While home prices declined by 0.4% nationally from November to December, regional variances continued. Figure 4 summarizes the current year’s monthly changes in December compared with averages recorded between 2015 and 2019.
Miami and Las Vegas posted the nation’s largest monthly gains, 0.3% and 0.2%, respectively. Detroit, which saw strength in home price growth in recent months, cooled off in December and posted a 0.7% decline, which was a larger decrease than seen in this period in Detroit prior to pandemic. In general, high mortgage rates in October and November of 2023 had an increasingly depressing impact on home prices in December before rates took a downward turn at the very end of the year.
Overall, 14 metro areas posted monthly price declines in December. Minneapolis and Portland, Oregon topped the list, with 1% declines in prices over the month – relatively more than these metros tend to see (Figure 4).

© 2024 CoreLogic,Inc., All rights reserved.
The month-over-month comparison of appreciation by price tier and location also reveals relative changes in demand across the country. In December, most metros and price tiers saw home prices fall. The largest slowdowns were in the high tier in Portland, Minneapolis and San Diego, while the high tiers in Washington, Las Vegas and Atlanta fared on the positive side. But all tiers on average saw price declines (Figure 5).

© 2024 CoreLogic,Inc., All rights reserved.
Lastly, Figure 6 illustrates average home price gains in 2023 compared with 2022. While 2023 saw a considerably slower rate of appreciation, areas in the South and Midwest continued to outpace the national average. The Northwest recorded declines for the year, though recent strength in that region suggests that home prices will bounce back in 2024.

© 2024 CoreLogic,Inc., All rights reserved.
While the S&P CoreLogic Case-Shiller Index continues to show home price resiliency against surging borrowing costs, it also highlights continued headwinds for the housing market, namely elevated mortgage rates and a severe lack of existing homes for sale. And as mortgage rates continue to hover in the 7% range, it will be difficult to convince existing homeowners to move at the current time. Nevertheless, as recent surge in mortgage application data has shown, following a drop in rates, buyers are anxiously waiting to jump into the market. That means that 2024 is likely to show another year of home price highs.
© 2024 CoreLogic,Inc., All rights reserved.