


-
U.S. year-over-year single-family home price appreciation was 5.3% in April, the same as in March.
-
All states posted annual appreciation in March, led by New Hampshire (12%), New Jersey (11%) and South Dakota (10.8%).
-
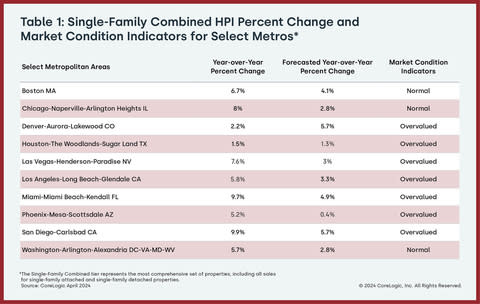
Of the 10 tracked major U.S. metro areas, San Diego (9.9%) overtook Miami (9.7%) for the top spot.
IRVINE, Calif., June 04, 2024–(BUSINESS WIRE)–CoreLogic®, a leading global property information, analytics and data-enabled solutions provider, today released the CoreLogic Home Price Index (HPI™) and HPI Forecast™ for April 2024.
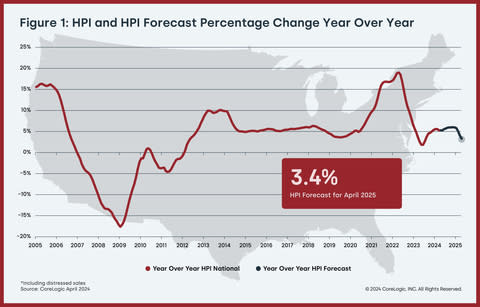
Annual U.S. home price appreciation remained above 5% in April, with three states posting double-digit gains. By next spring, national price gains are projected to slow to 3.4%, with only a few states putting up increases of higher than 6%. This slow cooling reflects not only the increasing number of homes on the market in some parts of the country, but also elevated, 30-year, fixed-rate mortgages, which remain around 7%, a major factor influencing America’s continuing housing affordability challenges.
“Home price growth continues to slow, as a comparison with a strong 2023 spring is still impacting year-over-year differences,” said Dr. Selma Hepp, chief economist for CoreLogic. “Nevertheless, the April uptick in mortgage rates to this year’s high has cooled some of the typical spring homebuyer demand, which pulled monthly gains of 1.1% below the March-to-April average.”
“The home price slowing also highlights buyers’ increased sensitivity to rising interest rates, as well as the anticipation that presumed lower rates down the road will help ease the affordability crunch,” Hepp continued. “Also, the price cooling is more pronounced in markets where there has been an influx of inventory and/or new construction, as well as those where additional homeownership costs (such as insurance, taxes and HOA fees) have risen relatively faster.”
Top Takeaways:
-
U.S. single-family home prices (including distressed sales) increased by 5.3% year over year in April 2024 compared with April 2023. On a month-over-month basis, home prices increased by 1.1% compared with March 2024.
-
In April, the annual appreciation of detached properties (5.7%) was 2 percentage points higher than that of attached properties (3.7%).
-
CoreLogic’s forecast shows annual U.S. home price gains relaxing to 3.4% in April 2025.
-
San Diego posted the highest year-over-year home price increase of the country’s 10 highlighted metro areas in April, at 9.9%. Miami saw the next-highest gain at 9.7%.
-
Among states, New Hampshire ranked first for annual appreciation in April (up by 12%), followed by New Jersey (up by 11%) and South Dakota (up by 10.8%). No state recorded year-over-year home price losses.
The next CoreLogic HPI press release, featuring May 2024 data, is scheduled to be issued on July 2, 2024, at 8 a.m. EST.
Methodology
The CoreLogic HPI™ is built on industry-leading public record, servicing and securities real-estate databases and incorporates more than 45 years of repeat-sales transactions for analyzing home price trends. Generally released on the first Tuesday of each month with an average five-week lag, the CoreLogic HPI is designed to provide an early indication of home price trends by market segment and for the Single-Family Combined tier, representing the most comprehensive set of properties, including all sales for single-family attached and single-family detached properties. The indices are fully revised with each release and employ techniques to signal turning points sooner. The CoreLogic HPI provides measures for multiple market segments, referred to as tiers, based on property type, price, time between sales, loan type (conforming vs. non-conforming) and distressed sales. Broad national coverage is available from the national level down to ZIP Code, including non-disclosure states.
CoreLogic HPI Forecasts™ are based on a two-stage, error-correction econometric model that combines the equilibrium home price—as a function of real disposable income per capita—with short-run fluctuations caused by market momentum, mean-reversion, and exogenous economic shocks like changes in the unemployment rate. With a 30-year forecast horizon, CoreLogic HPI Forecasts project CoreLogic HPI levels for two tiers — Single-Family Combined (both attached and detached) and Single-Family Combined Excluding Distressed Sales. As a companion to the CoreLogic HPI Forecasts, Stress-Testing Scenarios align with Comprehensive Capital Analysis and Review (CCAR) national scenarios to project five years of home prices under baseline, adverse and severely adverse scenarios at state, metropolitan areas and ZIP Code levels. The forecast accuracy represents a 95% statistical confidence interval with a +/- 2% margin of error for the index.
About Market Risk Indicators
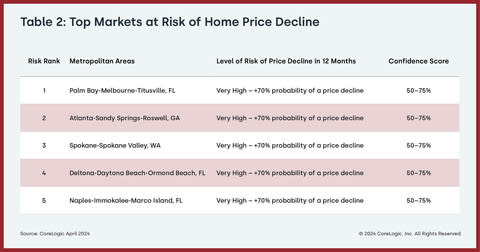
Market Risk Indicators are a subscription-based analytics solution that provide monthly updates on the overall health of housing markets across the country. CoreLogic data scientists combine world-class analytics with detailed economic and housing data to help determine the likelihood of a housing bubble burst in 392 major metros and all 50 states. Market Risk Indicators is a multi-phase regression model that provides a probability score (from 1 to 100) on the likelihood of two scenarios per metro: a >10% price reduction and a ≤ 10% price reduction. The higher the score, the higher the risk of a price reduction.
About the Market Condition Indicators
As part of the CoreLogic HPI and HPI Forecasts offerings, Market Condition Indicators are available for all metropolitan areas and identify individual markets as overvalued, at value or undervalued. These indicators are derived from the long-term fundamental values, which are a function of real disposable income per capita. Markets are labeled as overvalued if the current home price indexes exceed their long-term values by greater than 10% and undervalued where the long-term values exceed the index levels by greater than 10%.
Source: CoreLogic
The data provided are for use only by the primary recipient or the primary recipient’s publication or broadcast. This data may not be resold, republished or licensed to any other source, including publications and sources owned by the primary recipient’s parent company without prior written permission from CoreLogic. Any CoreLogic data used for publication or broadcast, in whole or in part, must be sourced as coming from CoreLogic, a data and analytics company. For use with broadcast or web content, the citation must directly accompany first reference of the data. If the data are illustrated with maps, charts, graphs or other visual elements, the CoreLogic logo must be included on screen or website. For questions, analysis or interpretation of the data, contact Robin Wachner at newsmedia@corelogic.com. For sales inquiries, visit https://www.corelogic.com/support/sales-contact/. Data provided may not be modified without the prior written permission of CoreLogic. Do not use the data in any unlawful manner. The data are compiled from public records, contributory databases and proprietary analytics, and its accuracy is dependent upon these sources.
About CoreLogic
CoreLogic is a leading provider of property insights and innovative solutions, working to transform the property industry by putting people first. Using its network, scale, connectivity and technology, CoreLogic delivers faster, smarter, more human-centered experiences that build better relationships, strengthen businesses and ultimately create a more resilient society. For more information, please visit www.corelogic.com.
CORELOGIC, the CoreLogic logo, CoreLogic HPI and CoreLogic HPI Forecast are trademarks of CoreLogic, Inc. and/or its subsidiaries. All other trademarks are the property of their respective owners.
View source version on businesswire.com: https://www.businesswire.com/news/home/20240604754107/en/
Contacts
Media Contact:
Robin Wachner
newsmedia@corelogic.com
Sales Contact:
https://www.corelogic.com/support/sales-contact/

Property prices across Australia have increased for the 16th straight month, with CoreLogic data showing an 0.8 per cent increase in May.
It’s also the biggest monthly increase since October last year, and takes the national median dwelling value to $785,556.
The figures also showed that Brisbane has become the second-most expensive capital city for property prices, overtaking Canberra.
It’s the first time since 1997 that the capital of the sunshine state has had the second-highest median dwelling value in Australia.
But for those who are hoping for relief from high property prices will be waiting a while yet, with CoreLogic’s head of research Tim Lawless noting conditions are unlikely to improve until more properties are built.
Here’s what property prices look like across the country.
What’s the most expensive city to buy in?
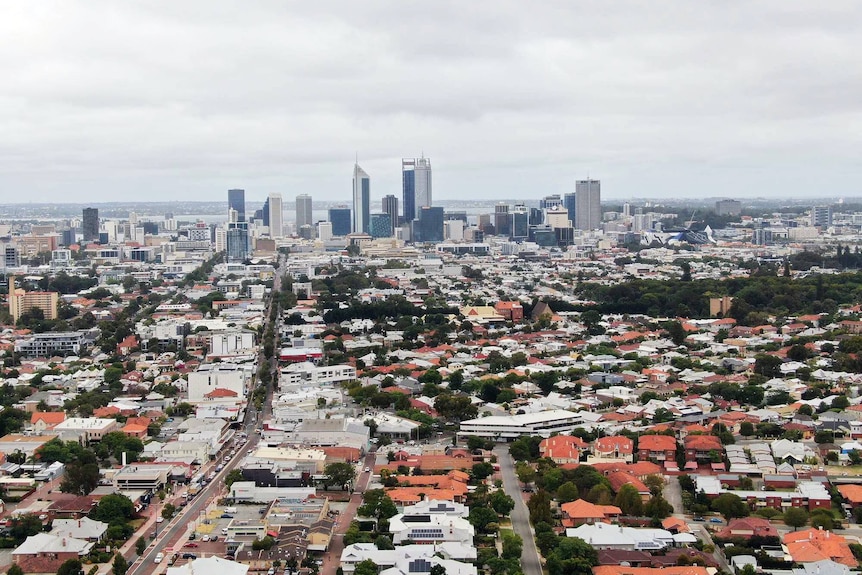
Sydney remains the most expensive place to buy property in the country, with a median house price of $1.4 million.
Over in Western Australia, Perth recorded the biggest increase to property prices in May, while Hobart and Darwin were the only two cities that saw prices fall slightly.
Here’s how much property prices changed around the country last month:
- Sydney: Increase of 0.6 per cent
- Melbourne: Increase of 0.1 per cent
- Brisbane: Increase of 1.4 per cent
- Adelaide: Increase of 1.8 per cent
- Perth: Increase of 2.0 per cent
- Hobart: Decrease of 0.5 per cent
- Canberra: Increase of 0.5 per cent
- Darwin: Decrease of 0.3 per cent
Keep scrolling for a more detailed look at each capital city, and how house and unit prices have changed since last year.
Alternatively, tap on one of the cities above to jump straight to its property values — or tap here to jump to changes to property prices in regional Australia.
Sydney
- Monthly change: 0.6 per cent increase
- Median house value: $1,441,957
- Median unit value: $848,961
Unsurprisingly, Sydney remains by far the most expensive city when it comes to house and unit prices.
CoreLogic noted that Sydney’s property market hit a “new milestone” in May, and is now equalling record high prices set at the peak in January 2022.
Dwelling values in Sydney fell by 12.4 per cent after that high, but CoreLogic said the city’s market has since seen a 14.1 per cent increase “through the cycle to date”.
Melbourne
- Monthly change: 0.1 per cent increase
- Median house value: $937,289
- Median unit value: $614,299
After recording a decrease of 0.1 per cent in April, Melbourne’s property prices recovered in May.
The Victorian capital has the fourth-highest median property price in the country, behind Sydney, Brisbane and Canberra.
Brisbane
- Monthly change: 1.4 per cent increase
- Median house value: $937,479
- Median unit value: $615,429
Brisbane recorded strong growth in its housing market in May to become the second-most expensive city in the country for property prices.
The Queensland capital is also now home to higher house and unit values than Melbourne, and its values have increased five times faster than those in Melbourne since the onset of the COVID-19 pandemic.
In fact, Brisbane values have grown by 59.2 per cent since the start of the pandemic, compared to Melbourne’s growth of 11.2 per cent.
Adelaide
- Monthly change: 1.8 per cent increase
- Median house value: $811,059
- Median unit value: $521,835
Considered a “mid-sized capital” by CoreLogic, Adelaide recorded the second-largest increase to property values in May.
Dwellings in Adelaide are relatively affordable compared to the national median value of $785,556, with the median property value in the South Australian capital coming in at $757,448.
Perth
- Monthly change: 2.0 per cent increase
- Median house value: $769,691
- Median unit value: $521,835
Perth recorded the largest growth in property prices in May, and its dwelling values have increased by 22 per cent in the past year.
Alongside its fellow mid-sized capitals Brisbane and Adelaide, Perth has been leading the pace of growth in the country’s housing market.
The number of properties available for sale remains more than 40 per cent below the five-year average for this time of year in Perth, and that limited supply is contributing to higher prices.
Hobart
- Monthly change: 0.5 per cent decrease
- Median house value: $697,770
- Median unit value: $523,843
Hobart was one of only two capital cities to see its property values decline in May, with house prices and unit prices falling by 0.5 per cent and 0.6 per cent respectively.
CoreLogic noted that listings across Hobart are 41 per cent higher than the five-year average, describing it as a “consequence of lower demand”, and noting that home sales are 6.4 per cent below the previous five-year average.
Canberra
- Monthly change: 0.5 per cent increase
- Median house value: $961,403
- Median unit value: $583,587
The modest increase to Canberra’s property prices in May saw it become the third-highest out of the capital cities, with Brisbane outpacing its growth.
In the past 12 months, property prices in Canberra have increased by 2 per cent.
Darwin
- Monthly change: 0.3 per cent decrease
- Median house value: $584,538
- Median unit value: $363,012
Although it is the most affordable city in the country, Darwin’s median property price is now slightly higher than $500,000.
CoreLogic noted that Darwin is the only capital city that didn’t follow the general trend of seeing a lower rate of growth for the upper quartile home values over the past year.
What do property prices look like in regional Australia?
Property prices in regional Australia are still considerably cheaper compared to the capital cities in the states and territories.
Over the past year, regional property prices have increased by 6.8 per cent, with a median value of $626,888.
In May, only regional Tasmania and regional Victoria saw a decline in dwelling values, with both dipping by 0.2 per cent.
Similarly to Perth, regional Western Australia saw the largest increase to dwelling values last month, growing by 1.8 per cent.
Regional South Australia and regional Queensland also saw modest growth of 1.4 per cent and 1.1 per cent respectively.
Loading…
If you’re unable to view the form, you can access it here.

Australian dwelling prices have experienced their largest monthly increase since October last year, rising by 0.8 per cent in May, with the middle-valued home in Australia now worth $785,556, according to new data released by CoreLogic.
It also marks the 16th straight month of price increases, as demand for housing remains well above the low levels of supply across the country.
Sydney remains the most expensive capital city with a median home price of $1.15 million — including both standalone houses and apartments — after recording 0.6 per cent growth during May.
However, Brisbane has now become the second-most expensive city for housing in the country, with prices jumping by 1.4 per cent during the month, and taking the median property price to $843,231.
It is the first time since 1997 that Brisbane has recorded the second-highest median dwelling value.
Canberra is now the third-most expensive capital city, followed by Melbourne, Adelaide and Perth.
CoreLogic’s research director Tim Lawless said the difference in the growth rates between the capital cities was due to low levels of supply in the markets that experienced the strongest demand — particularly in the mid-sized capitals.
“To say the housing market has been resilient is an understatement,” Mr Lawless said.
“Housing values are continuing to rise across most areas and housing types, with growth accelerating in some markets.
“The common denominator remains a mismatch between housing supply and housing demand.”
CoreLogic data showed that the available supply of homes for sale remains well below average, and is almost 2 per cent lower than it was 12 months ago.
Comparatively, demonstrated demand for housing is still above average, and is 2.8 per cent higher than a year ago.
“It’s this disconnect between supply and demand that is trumping the downside pressures from interest rates, high inflation and low sentiment,” Mr Lawless said.
“Despite worsening affordability pressures, from both a purchasing and a rental perspective, Australian residents still need to keep a roof over their heads.”
Housing supply and demand will eventually even out, he said, due to slower population growth and a surge in construction.
However, Mr Lawless said that until more housing is built Australians can expect “further upwards pressure” on housing values, and “further erosion in housing affordability”.

Brisbane house prices now higher than Melbourne
Dwelling values in Brisbane first overtook the median value for Melbourne back in January, which CoreLogic attributed to Melbourne having a higher concentration of “relatively cheap” units and apartments.
Four months later, CoreLogic noted that house values in Brisbane are now higher than the median house value in Melbourne.
It’s the first time since June 2008 that Brisbane’s house prices have been more expensive than those in Melbourne.
CoreLogic data shows that Brisbane’s median house value is currently $937,479 — which is $190 more than Melbourne’s median house value.
Brisbane’s median unit value of $615,429 is also higher than Melbourne’s median unit value by $1,130.

The change in values means Brisbane’s property prices have increased by more than five times the pace of those in Melbourne since the COVID-19 pandemic, with CoreLogic figures showing Brisbane’s property values have grown by 59.8 per cent compared to 11.2 per cent in Melbourne.
Prior to the pandemic, CoreLogic said Melbourne’s median dwelling value had premium of about 37 per cent compared to Brisbane.
“The number of properties available for sale in Perth and Adelaide remain more than -40 per cent below the five-year average for this time of the year while Brisbane listings are -34 per cent below average,” Mr Lawless said.
“Inventory levels in these markets remain well below average despite vendor activity lifting relative to this time last year.
“Fresh listings are being absorbed rapidly by market demand, keeping stock levels low and upwards pressure on prices.”
Loading…
If you’re unable to view the form, you can access it here.
Posted , updated

Behind the smiles and sold stickers, there appears to be a secret story of heartbreak behind a small but rapidly growing segment of home sales.
Figures from CoreLogic show a record 16 per cent of sales early this year were properties that had last changed hands less than three years prior.
Typically, this can be a sign of a hot property market, where investors are flipping houses and apartments to make a quick (and tax-effective) buck.
There’s probably a bit of this going on, with property prices back at record highs across much of Australia.
But the proportion of quick resales is notably higher than in previous boom markets, so it looks like there’s another factor at play.
As CoreLogic’s Eliza Owen says, that factor appears to be mortgage hardship.
“Where we’ve seen a rise in short-term resales, it’s probably a combo of mortgage stress and big capital gain windfalls,” she told me.
Is there evidence for this hunch? Yes, there is, fresh from the financial regulator.
Last week, ASIC released a critical report highlighting the many deficiencies in how banks treat customers suffering financial hardship.
My colleague Dan Ziffer wrote about it in detail.
However, that report also contained fresh data lifting a lid on Australia’s emerging mortgage crisis.
ASIC noted a 54 per cent surge in mortgage hardship notices lodged with banks over the final three months of 2023 compared with the same period in 2022.
In the report, ASIC notes: “A hardship notice is where a customer advises their lender of their inability to meet their obligations under a credit contract.”
Last year alone, 30 of Australia’s biggest lenders recorded more than 444,000 hardship notices connected to nearly 300,000 accounts.
About 40 per cent of these were related to mortgages, with more than 116,000 home loan accounts affected.

ASIC said more than 80 per cent of those, so at least 93,000, related to owner-occupier loans.
Mortgage cliff no myth
Close to 3.5 million Australian households have a mortgage on the home they live in, so that’s roughly 2.7 per cent of home loan borrowers who’ve told their bank they can’t pay under their current terms.
That’s a far more alarming number than the 0.7 per cent of home loans in 90-day arrears, which is commonly when banks start foreclosure procedures.
Alongside that arrears figure in the Reserve Bank’s latest Financial Stability Review, it noted, “a small but increasing share of borrowers have requested and received temporary hardship arrangements from their lenders, which has contributed to arrears rates remaining a little lower than would have otherwise been the case”.
If the RBA had a sneak peek of ASIC’s report, then “small but increasing” seems an understatement.
Some media and economic commentators have fixated on the relatively low rate of mortgage arrears as evidence that the mortgage cliff was a myth.
For those unfamiliar with the term, the mortgage cliff describes those who took out very cheap fixed-rate loans during the pandemic and are now rolling onto variable rates that are in most cases about three times higher.
Ignoring the fact that hundreds of thousands of borrowers are still rolling off cheap fixed rates this year, the hardship data from the end of 2023 appear to confirm that the cliff exists — it’s just that many banks have thrown their struggling customers a rope to keep them from tumbling to the bottom, at least temporarily.
Hardship provisions are designed to help people who’ve had a temporary setback — job loss, health problems, a relationship breakdown, natural disasters — until they can hopefully sort out their affairs and get back on track.
But ASIC’s survey showed the most common reason for seeking hardship assistance on mortgages was “overcommitment”.

In an interview with The Business, ASIC’s chair denied that meant what it appeared to say on the sticker — that tens of thousands of customers were lent too much money in the first place.
But given that the survey included reduced income, unemployment, medical, separation, bereavement, business failure, parental leave, abuse, natural disaster and others as a fairly exhaustive list of alternative categories, it’s hard not to conclude that banks simply lent too much money to a large group of people without factoring in sufficient buffers for interest rates rising.
It’s not surprising they did, and it’s equally unsurprising regulators are reluctant to admit it because it was a rule change by banking regulator APRA in 2019 that dropped a 7 per cent interest rate floor on mortgage serviceability tests for home loan applicants.
As rates fell in the lead-up to the pandemic, and then plunged with the RBA’s extraordinary stimulus, the repayment buffers that prospective borrowers were expected to demonstrate fell with them.
Given that APRA, ASIC and the RBA all sit on the Council of Financial Regulators, which oversees financial stability, it’s little wonder they are reluctant to acknowledge that many Australians were simply lent too much between 2020-2021.
To do so would be to admit they made a bad call to lower lending standards in 2019, acting after public requests from both the Morrison government and some of the big banks to ease restrictions on home loans.
‘Distressed’ sales at lows despite rising hardship
It must be noted that “during the review period, more than half the hardship notices related to home loans that had been open for more than five years”.
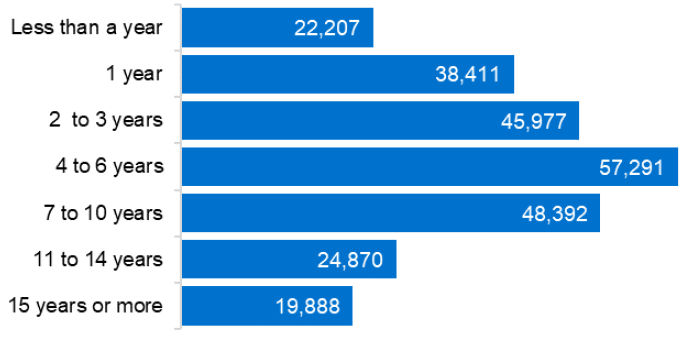
It makes sense that older loans account for a large share of hardship, as enough time has passed for many otherwise sound borrowers to fall foul of one of life’s many potential misfortunes.
But there was a sizeable group who were already in trouble less than three years into their mortgage.
This is the group that appears to be picked up by CoreLogic’s data, selling voluntarily before their hand is forced by their lender.
Thanks to generally rising property prices, most can get out without foreclosure or bankruptcy.
That’s probably why Domain’s index of “distressed listings” remains low.
It scrapes ads on the real estate website for terms like “urgent sale”, “desperate seller”, “mortgage in possession”, “repossession”, “distressed property/sale” and “forced property sale”.
Let’s face it, how many sellers want to tell prospective buyers they are desperate to sell?
But, with the ASIC report showing about 40 per cent of hardship cases falling straight into arrears once their assistance package ended, it wouldn’t be surprising to see distressed listings, and the broken dreams attached to them, on the rise later this year.
That distress could be compounded if a rise in listings reverses the growth in property prices that has given many borrowers a pass out of mortgage prison.
Posted , updated

Australia’s property market is showing no signs of slowing down, with data from CoreLogic showing property prices increased by 0.6 per cent in April.
It’s the 15th month in a row that Australia’s property prices have increased, with the national median dwelling value now $779,819.
CoreLogic’s head of research Tim Lawless said higher interest rates, worsening housing affordability and cost of living pressures are keeping property prices higher.
Coupled with a “mismatch” of demand for housing and limited supply, Mr Lawless warned that higher property prices are unlikely to ease in the “near future”.
Here’s what property prices look like across the country.
What’s the most expensive city to buy in?
Sydney remains the most expensive place to buy property in the country, with a median house price of $1.4 million.
But it was the Western Australian capital of Perth that saw the biggest increase to property prices in April, while Melbourne was the only city to see a slight fall in prices.
Here’s how much property prices changed in each city in April:
- Sydney: Increase of 0.4 per cent
- Melbourne: Decrease of 0.1 per cent
- Brisbane: Increase of 0.9 per cent
- Adelaide: Increase of 1.3 per cent
- Perth: Increase of 2.0 per cent
- Hobart: Increase of 0.3 per cent
- Canberra: Increase of 0.2 per cent
- Darwin: Increase of 0.6 per cent
Keep scrolling for a more detailed look at each capital city, and how house and unit prices have changed since last year.
Alternatively, tap on one of the cities above to jump straight to its property values — or tap here to jump to changes to property prices in regional Australia.
Sydney
- Monthly change: 0.4 per cent increase
- Median house value: $1,421,413
- Median unit value: $844,659
Properties in Sydney continue to have the highest median prices for both houses and units in the country.
CoreLogic noted that Sydney’s property prices have “held reasonably firm”, increasing by 0.4 per cent each month for the past three months.
Melbourne
- Monthly change: 0.1 per cent decrease
- Median house value: $941,698
- Median unit value: $613,023
Melbourne is the only capital city that saw a slight drop in property values in April, and has the fourth-highest median property price in the country, behind Sydney, Canberra and Brisbane.
CoreLogic noted that the Victorian capital’s property market has “broadly stabilised after recording a -0.8 per cent dip over the three months to January”.
Brisbane
- Monthly change: 0.9 per cent increase
- Median house value: $920,046
- Median unit value: $600,215
After previously recording strong gains, Brisbane’s property prices dipped below 1 per cent in April for the first time in 12 months.
“We are seeing the pace of gains slow across the Brisbane market,” said CoreLogic’s head of research Tim Lawless.
“Affordability pressures may be impacting the pace of growth across the city, following a nearly $300,000 increase in values since the onset of COVID in March 2020, the largest dollar value increase of any capital.”
Adelaide
- Monthly change: 1.3 per cent increase
- Median house value: $800,648
- Median unit value: $514,369
As a “mid-sized capital”, properties in Adelaide saw the second-biggest value increase of the capital cities in April.
Compared to the national median property price of $779,817, dwellings in Adelaide are relatively affordable with a median value of $747,732.
In the past 12 months, however, Adelaide’s property prices have increased by 14 per cent.
Perth
- Monthly change: 2.0 per cent increase
- Median house value: $753,947
- Median unit value: $508,988
Perth remains the capital city with the largest growth in property prices, and has seen dwelling values increase by 21.1 per cent in the past year.
“We aren’t seeing any signs of heat coming out of the Perth housing market just yet,” Mr Lawless said.
“In fact, the quarterly pace of growth at 6 per cent is approaching the cyclical highs seen during the pandemic, when interest rates were at rock bottom.”
Hobart
- Monthly change: 0.3 per cent increase
- Median house value: $692,004
- Median unit value: $528,625
Despite a rise in monthly prices, property values in Hobart are now 0.4 per cent lower compared to a year ago.
Hobart was also the only capital city where there was a larger gain in house prices compared to units in the past three months, Mr Lawless said.
ABC News: Maren Preuss
)
Canberra
- Monthly change: 0.2 per cent increase
- Median house value: $972,699
- Median unit value: $592,879
The housing market in Canberra saw a mild increase in house values in April, with the median house price the second-highest out of any capital city.
In the past 12 months, property prices in Canberra have increased by 2.1 per cent.
Darwin
- Monthly change: 0.6 per cent increase
- Median house value: $579,229
- Median unit value: $364,075
The capital of the Northern Territory remains the most affordable city in the country, with a median property price under $500,000.
CoreLogic noted that housing affordability is “less challenging” in Darwin, which has seen a 1.9 per cent annual increase to dwelling values in the past year.
What do property prices look like in regional Australia?
Compared to the capital cities, prices in the regions are considerably cheaper in each state and territory.
However, CoreLogic data shows that regional property prices have increased at a faster rate than prices in the capital cities in the first four months of the year.
Regional property prices have increased by 2.6 per cent so far this year, while property prices in capital cities have risen 2.1 per cent.
CoreLogic noted that regional markets with the strongest increases were aligned with the capital cities that had the most growth.
Over the past three months, CoreLogic data showed property prices in regional Western Australia had the largest gains, followed by regional South Australia and regional Queensland.
Loading…
If you’re unable to view the form, you can access it here.
Posted , updated