
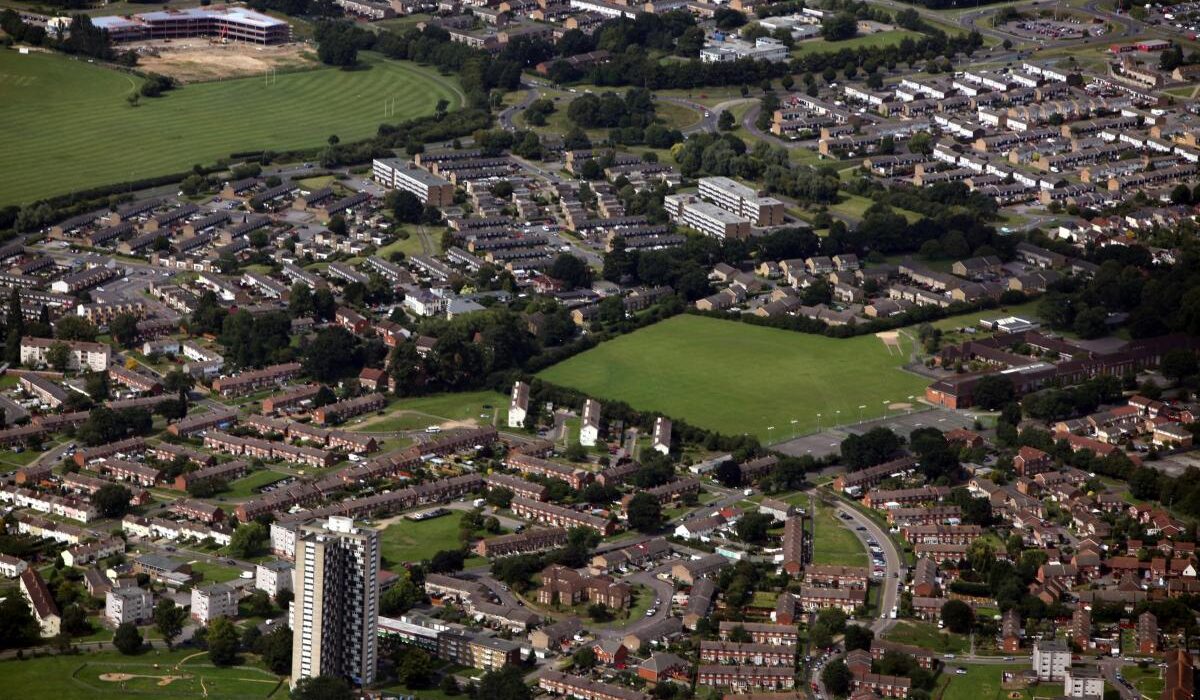
A new report has revealed the cheapest and most expensive places in Southampton and wider Hampshire to buy a home.
The report ranks SO postcodes based on their average house price, revealing the cheapest and most expensive place to live.
With constant inflation rises, the opportunity for first-time buyers to get a mortgage offer that is affordable and reasonable is extremely difficult.
Responding to this ongoing change, steel roofing manufacturer, Cardinal Steels, and Online Marketing Surgery have created a house price report.
This report ranks SO postcodes based on their average house price.
Key findings from the report:
Southampton City Centre and the SO14 postcode is the cheapest area in Southampton to buy a property with an average price of £224,192.
The area in Southampton with the highest house prices is Bishops Waltham and the SO32 postcode, with an average price of £536,579.
When it came to places in the Southampton SO postcode area, Beaulieu and the SO42 postcode had the highest prices with £915,314.
Average house prices:
Southampton City Centre (SO14) – £224,192
Sholing (SO19) – £249,468
Highfield (SO17) – £252,507
Bitterne (SO18) – £264,634
Shirley (SO15) – £264,680
Bassett (SO16) – £296,791
Botley (SO30) – £332,722
Totton (SO40) – £350,679
Hythe (SO45) – £367,037
Warsash (SO31) – £399,353
North Baddesley (SO52) – £420,258
Bishops Waltham (SO32) – £536,579
The report also highlighted the house prices in areas with a Southampton postcode.
SO postcode areas average house prices:
Southampton City Centre (SO14) – £224,192
Sholing (SO19) – £249,468
Highfield (SO17) – £252,507
Bitterne (SO18) – £264,634
Shirley (SO15) – £264,680
Bassett (SO16) – £296,791
Eastleigh Town Centre (SO50) – £319,770
Botley (SO30) – £332,722
Totton (SO40) – £350,679
Hythe (SO45) – £367,037
Warsash (SO31) – £399,353
North Baddesley (SO52) – £420,258
Chandler (SO53) – £460,273
Romsey (SO51) – £462,940
Bishops Waltham (SO32) – £536,579
Lyndhurst (SO43) – £572,243
Winchester City Centre (S023) – £585,146
Milford-on-Sea (SO41) – £643,053
Badger Farm (SO22) – £652,510
New Alresford (SO24) – £681,899
Compton (SO21) – £702,248
Stockbridge (SO20) – £825,437
Beaulieu (SO42) – £915,314
by Calculated Risk on 4/27/2024 08:11:00 AM
The key report scheduled for this week is the April employment report.
Other key reports include February Case-Shiller house prices, April vehicle sales, and the March trade balance.
The FOMC meets this week and no change to policy is expected.
For manufacturing, the April Dallas Fed manufacturing survey, and the ISM index will be released.
—– Monday, April 29th —–
10:30 AM: Dallas Fed Survey of Manufacturing Activity for April.
—– Tuesday, April 30th —–
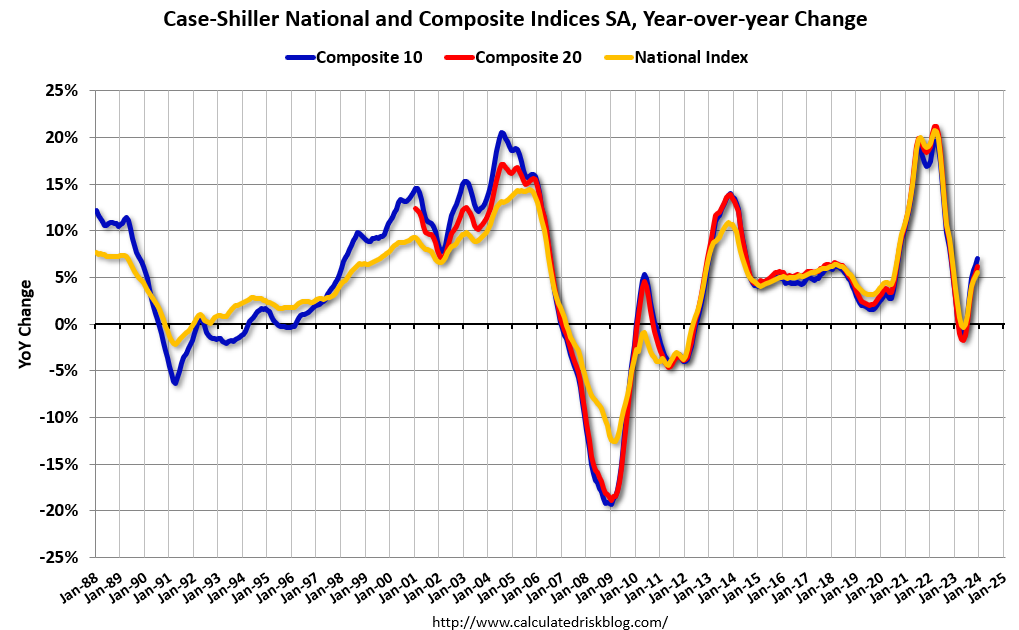
 9:00 AM: S&P/Case-Shiller House Price Index for February.
This graph shows the nominal seasonally adjusted National Index, Composite 10 and Composite 20 indexes through the most recent report (the Composite 20 was started in January 2000).
The consensus is for a 6.7% year-over-year increase in the Comp 20 index for February.
9:00 AM: FHFA House Price Index for February. This was originally a GSE only repeat sales, however there is also an expanded index.
9:45 AM: Chicago Purchasing Managers Index for April. The consensus is for a reading of 45.0, up from 41.4 in March.
10:00 AM: the Q1 2024 Housing Vacancies and Homeownership from the Census Bureau.
—– Wednesday, May 1st —–
7:00 AM ET: The Mortgage Bankers Association (MBA) will release the results for the mortgage purchase applications index.
8:15 AM: The ADP Employment Report for April. This report is for private payrolls only (no government). The consensus is for 180,000 payroll jobs added in April, down from 184,000 added in March.
10:00 AM ET: ISM Manufacturing Index for April. The consensus is for the ISM to be at 50.1, down from 50.3 in March.
10:00 AM: Construction Spending for March. The consensus is for a 0.3% increase in construction spending.
 10:00 AM ET: Job Openings and Labor Turnover Survey for March from the BLS.
This graph shows job openings (black line), hires (dark blue), Layoff, Discharges and other (red column), and Quits (light blue column) from the JOLTS.
Jobs openings were little changed in February at 8.76 million from 8.75 million in January.
The number of job openings (black) were down 11% year-over-year in February.
2:00 PM: FOMC Meeting Announcement. No change to policy is expected at this meeting.
2:30 PM: Fed Chair Jerome Powell holds a press briefing following the FOMC announcement.
 All day: Light vehicle sales for April. The expectation is for light vehicle sales to be 15.7 million SAAR in April, up from 15.5 million in March (Seasonally Adjusted Annual Rate).
This graph shows light vehicle sales since the BEA started keeping data in 1967. The dashed line is the sales rate for the previous month.
—– Thursday, May 2nd —–
8:30 AM: The initial weekly unemployment claims report will be released. The consensus is for 210 thousand initial claims, up from 207 thousand last week.
 8:30 AM: Trade Balance report for March from the Census Bureau.
This graph shows the U.S. trade deficit, with and without petroleum, through the most recent report. The blue line is the total deficit, and the black line is the petroleum deficit, and the red line is the trade deficit ex-petroleum products.
The consensus is the trade deficit to be $68.8 billion. The U.S. trade deficit was at $68.9 billion in February.
—– Friday, May 3rd —–
 8:30 AM: Employment Report for April. The consensus is for 210,000 jobs added, and for the unemployment rate to be unchanged at 3.8%.
There were 303,000 jobs added in March, and the unemployment rate was at 3.8%.
This graph shows the jobs added per month since January 2021.
10:00 AM: the ISM Services Index for April. The consensus is for a reading of 52.0, up from 51.4.
With house prices soaring at the moment it’s no wonder that many land on property pages with sky high prices.
This is no exception for our town where we see some of the swankiest houses outside of London, with an extortionate price tag to match.
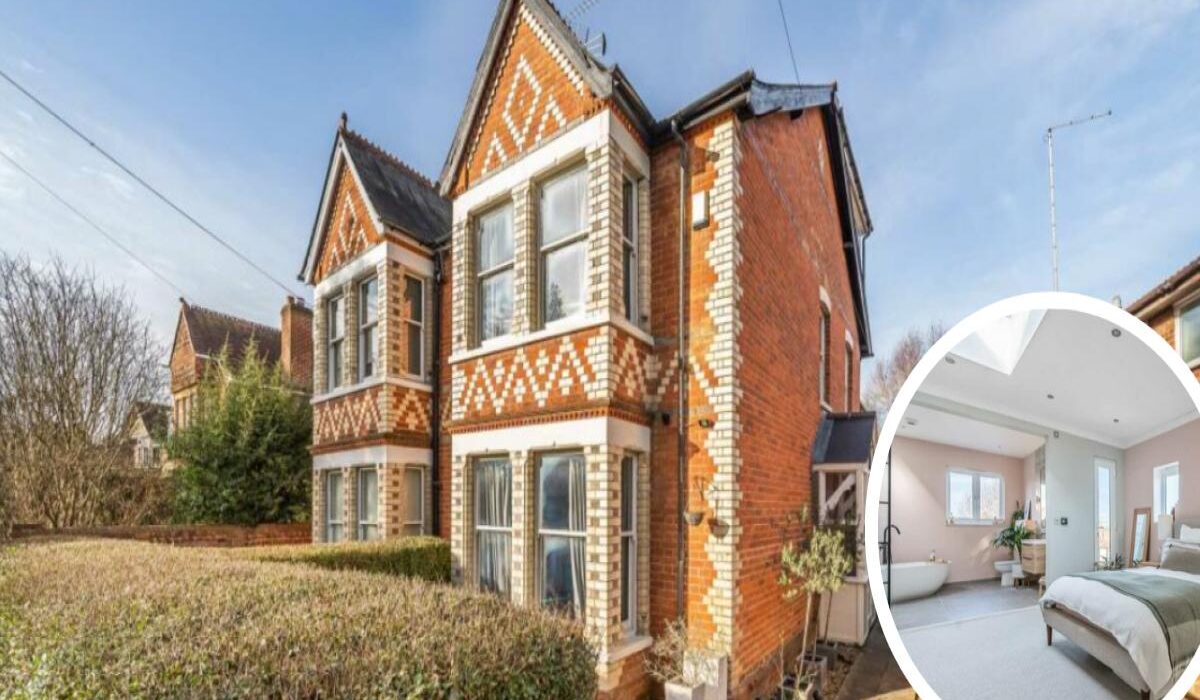
But what can shed loads of money actually buy you in Reading? This house is currently sitting on Rightmove for one million pounds.
Situated in Caversham Heights, the four bed four bathroom semi-detached house offers prospective buyers with the perfect balance of modern and decadent living.
Located on a sought after road in Caversham Heights, the house is close to Caversham and Reading centres, along with Reading mainline station.
Presented in truly immaculate condition throughout, this swanky house has undergone major improvements, including a recent loft conversion and rear extension, new kitchen with underfloor heating, new bi-folding doors, refurbished sash windows, oak flooring, new ensuite, new flat roofs, new carpets and much more.
Further benefits include a master bedroom with an open plan ensuite, bedroom two with ensuite, family bathroom, living room, dining room, kitchen breakfast room, morning room, utility room, downstairs WC, and a good size rear garden.
At the front of the house there is a garden area and a path leading to the front door. There is also the possibility of creating off-road parking to the front if desired.
To the rear there is a good-sized garden, which is mainly laid to lawn, along with a patio area.

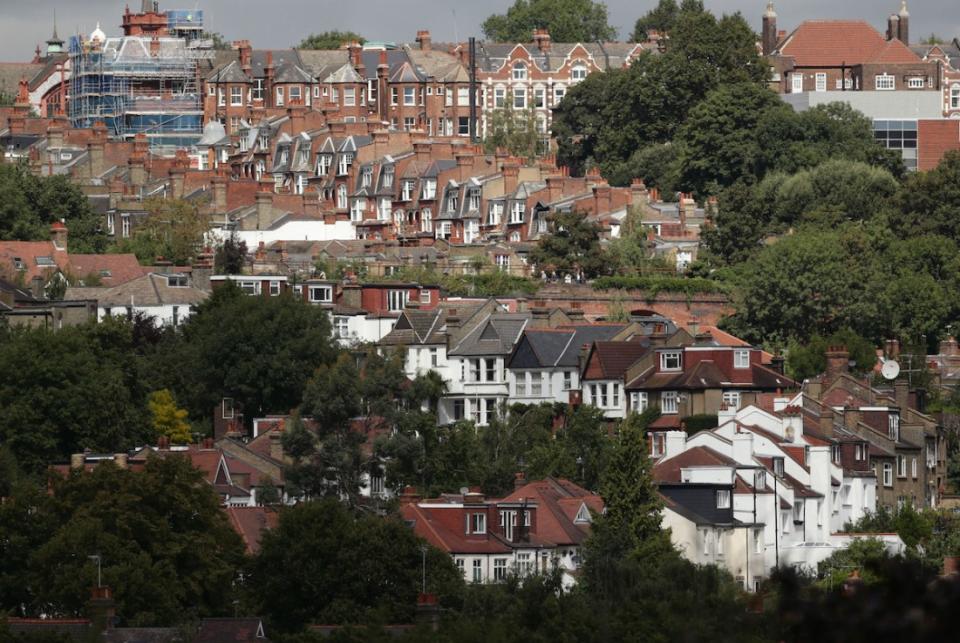
After a challenging few years green shoots appear to be emerging in London’s property market.
For the month of April average prices in the capital rose by 2.8 per cent year-on-year to £696,000 with a property taking around 63 days to sell, a new report by Rightmove showed.
It suggests there is an increasing demand in the capital to buy a home, in February a similar report by the property portal showed it took 84 days to sell a home and the price of a property cost £682,000.
Over the past two years, the ecosystem of London’s property market has been rocked by a number of factors.
The fall out from Liz Truss’s September 2022 mini-budget which included £45bn of unfunded tax cuts, led to a fall in value of the pound and mortgage rates to skyrocket over five per cent.
Meanwhile Russia’s invasion of Ukraine placed a squeeze on critical economies such as food and energy, leading inflation to outpace wage growth.
Rising inflation, which climbed to over 10 per cent at some points last year, also meant the Bank of England was steadily raising interest rates further, to help curb soaring costs.
This led buyers to struggle with affordability and mortgage costs, which in turn led to a slowdown in the number of homes being bought in the capital.
London house prices in April
Across the board, most London boroughs saw house prices rise during the month.
The most affordable place to purchase a home was Barking and Dagenham where prices rose 1.4 per cent during the month to £365,000.
This was followed by Bexely where prices rose 1.3 per cent to £479,000.
Harveing, Croydon and Greenwich also had properties on the market for less than £500,000.
Traditionally affluent areas such as Westminster and Hammersmith and Fulham also experienced price growth of 3.4 per cent and 1.8 per cent respectively.
Homes in these boroughs are not below one million pounds.
Jeremy Leaf, north London estate agent and a former RICS residential chairman, told City A.M. the London market is continuing to “play catch-up as the increase in new enquiries is emboldening sellers, not only to make their properties available, but chance their arm at higher asking figures”.
“We need to bear in mind too that the latest house price indices from lenders such as Nationwide and Halifax do not include cash buyers which make up over a third of purchases and is a sector of the market which is active at present – and especially in London,” he added.
Leaf said Bank of England mortgage approvals – which set the scene for the market over the next few month – are rising, which is a good sign that the “traditionally busy spring market will live up to expectations”.
“Strong employment and falling inflation are helping too, along with the fact that the direction of travel for interest rates appears to be south,” he explained.
“The prospect of more stable or even falling mortgage rates is certainly helping to improve confidence generally.”
He added: “However, the uplift in supply has meant more choice so the market remains price sensitive and buyers are negotiating hard, particularly those who require little or no finance.”
High rental costs impact would be tenants
Monday’s reading comes as figures published last week show London was the English region with the lowest annual inflation, where prices decreased by 4.8 per cent in the 12 months to February 2024.
Matt Thompson, head of sales at Chestertons, said: “Although the number of buyers and sellers has seen an increase in April so far, demand still outweighs supply which gives sellers the upper hand during price negotiations.
“Current speculation that interest rates might be cut over the coming months could see an additional increase in buyers which could result in sellers persisting on or increasing their asking prices.”
But renting costs have skyrocketed in recent months, hindering tenants ability to save to get on the property ladder.
A report by the ONS showed last week that London was the English region with the highest annual rents inflation in the 12 months to March 2024, at 11.2 per cent, which was up from 10.6 per cent in February 2024.
Rental prices are however expected to hit an affordability ceiling this year and reach their peak.
| 2020 | April | 7.6 |
|---|---|---|
| 2020 | May | 7.9 |
| 2020 | June | 7.7 |
| 2020 | July | 7.6 |
| 2020 | August | 8.3 |
| 2020 | September | 8.7 |
| 2020 | October | 9.1 |
| 2020 | November | 8.9 |
| 2020 | December | 8.3 |
| 2021 | January | 9.3 |
| 2021 | February | 10.2 |
| 2021 | March | 11.1 |
| 2021 | April | 11.2 |
| 2021 | May | 12.8 |
| 2021 | June | 14.5 |
| 2021 | July | 16.1 |
| 2021 | August | 17.6 |
| 2021 | September | 18.3 |
| 2021 | October | 18.2 |
| 2021 | November | 20 |
| 2021 | December | 20.2 |
| 2022 | January | 20.9 |
| 2022 | February | 20 |
| 2022 | March | 19.4 |
| 2022 | April | 19.6 |
| 2022 | May | 18.4 |
| 2022 | June | 16.4 |
| 2022 | July | 14.2 |
| 2022 | August | 11.6 |
| 2022 | September | 9.1 |
| 2022 | October | 7.5 |
| 2022 | November | 4.5 |
| 2022 | December | 2.2 |
| 2023 | January | 0.7 |
| 2023 | February | -1.2 |
| 2023 | March | -2.6 |
| 2023 | April | -4.7 |
| 2023 | May | -5.8 |
| 2023 | June | -5.7 |
| 2023 | July | -5.5 |
| 2023 | August | -4.7 |
| 2023 | September | -3.4 |
| 2023 | October | -2.1 |
| 2023 | November | -0.6 |
| 2023 | December | 1.9 |
| 2024 | January | 1.8 |
| 2024 | February | 4.3 |
| 2024 | March | 5.4 |
| Source: CBS, Kadaster | ||
House prices up by 0.7 percent on February
The price index for existing owner-occupied dwellings increased by 0.7 percent in March relative to February. House prices in the Netherlands peaked in July 2022. After that, they declined for a year. Since June 2023, prices of owner-occupied dwellings have been increasing again. In March 2024, prices were 0.2 percent below the July 2022 peak.
| 2020 | April | 98.3 |
|---|---|---|
| 2020 | May | 99.1 |
| 2020 | June | 99.3 |
| 2020 | July | 100.3 |
| 2020 | August | 101.1 |
| 2020 | September | 102.1 |
| 2020 | October | 103 |
| 2020 | November | 103.3 |
| 2020 | December | 102.9 |
| 2021 | January | 105.4 |
| 2021 | February | 106.6 |
| 2021 | March | 108.3 |
| 2021 | April | 109.4 |
| 2021 | May | 111.7 |
| 2021 | June | 113.7 |
| 2021 | July | 116.4 |
| 2021 | August | 118.9 |
| 2021 | September | 120.7 |
| 2021 | October | 121.8 |
| 2021 | November | 124 |
| 2021 | December | 123.7 |
| 2022 | January | 127.4 |
| 2022 | February | 127.9 |
| 2022 | March | 129.3 |
| 2022 | April | 130.7 |
| 2022 | May | 132.3 |
| 2022 | June | 132.4 |
| 2022 | July | 132.9 |
| 2022 | August | 132.7 |
| 2022 | September | 131.7 |
| 2022 | October | 130.9 |
| 2022 | November | 129.6 |
| 2022 | December | 126.5 |
| 2023 | January | 128.2 |
| 2023 | February | 126.4 |
| 2023 | March | 125.9 |
| 2023 | April | 124.6 |
| 2023 | May | 124.6 |
| 2023 | June | 124.9 |
| 2023 | July | 125.6 |
| 2023 | August | 126.4 |
| 2023 | September | 127.2 |
| 2023 | October | 128.1 |
| 2023 | November | 128.7 |
| 2023 | December | 129 |
| 2024 | January | 130.5 |
| 2024 | February | 131.8 |
| 2024 | March | 132.7 |
| Source: CBS, Kadaster | ||
More homes bought and sold in March
According to The Netherlands’ Cadastre, the total number of dwellings bought and sold recorded during the month of March stood at 16,179. That is an increase of almost 5 percent relative to one year previously. In the first three months of this year, a total of 44,441 dwellings changed ownership; an increase of almost 10 percent relative to one year previously.
In March, the average transaction price for an owner-occupied dwelling was 432,061 euros. However, it is not the transaction price but the price index that is used to determine price changes for existing owner-occupied dwellings. Unlike the price index, the average transaction price does not take into account differences in the quality of homes.
| 2020 | April | 9 |
|---|---|---|
| 2020 | May | -6.9 |
| 2020 | June | 14.4 |
| 2020 | July | 7.3 |
| 2020 | August | -2.8 |
| 2020 | September | 12.5 |
| 2020 | October | 17.8 |
| 2020 | November | 0.6 |
| 2020 | December | 16.1 |
| 2021 | January | 39.9 |
| 2021 | February | 9.4 |
| 2021 | March | 35.5 |
| 2021 | April | 0.5 |
| 2021 | May | -12.1 |
| 2021 | June | -0.1 |
| 2021 | July | -15.6 |
| 2021 | August | -9.3 |
| 2021 | September | -14.7 |
| 2021 | October | -26.9 |
| 2021 | November | -13 |
| 2021 | December | -21.6 |
| 2022 | January | -42.7 |
| 2022 | February | -16.8 |
| 2022 | March | -37.3 |
| 2022 | April | -15.7 |
| 2022 | May | -2.3 |
| 2022 | June | -11.6 |
| 2022 | July | -13.8 |
| 2022 | August | -4.9 |
| 2022 | September | 0.3 |
| 2022 | October | -8.2 |
| 2022 | November | -5.6 |
| 2022 | December | 3.8 |
| 2023 | January | -6.6 |
| 2023 | February | -15.5 |
| 2023 | March | -2.4 |
| 2023 | April | -19.8 |
| 2023 | May | -4.1 |
| 2023 | June | 5.9 |
| 2023 | July | -9.1 |
| 2023 | August | -2.9 |
| 2023 | September | -8.7 |
| 2023 | October | 5.7 |
| 2023 | November | 0.7 |
| 2023 | December | -8.3 |
| 2024 | January | 10.1 |
| 2024 | February | 16.5 |
| 2024 | March | 4.7 |
| Source: CBS, Kadaster | ||

House prices in Wales have fallen to their lowest levels in nearly two years.
The average house price in Wales fell to £229,263 in the first quarter of 2024, making this the fifth consecutive quarter that prices have fallen.
House prices are now almost £20,000 below the peak recorded at the back end of 2022, according to figures from Principality Building Society’s Wales House Price Index.
The Principality Index for the first quarter (Q1) of 2024 shows the rise and fall in house prices in each of the 22 local authorities in Wales.
Principality’s report shows the average house price in Wales has fallen by 2.1% since last quarter and is now down 6.5% when compared to the same period the previous year.
Changes to average house prices in counties across Wales
The biggest change in average house prices across Q1 of 2024 for Wales was recorded in the Vale of Glamorgan.
The south Wales county saw house prices, on average, fall by 11.8% in Q1 meaning it has now seen an average annual drop of 15.7%.
The next biggest change was recorded in Anglesey, where average house prices fell by 11.2% in the first quarter of 2024.
The biggest increases (for Q1) were recorded in Blaenau Gwent, up 8.6%, and Flintshire, up 8.5%.
All the average house price changes in each county from Q1 in 2024 can be found below:
-
Anglesey – average house price: £250,303 (annual change: -6.5% / quarterly change: -11.2%)
-
Blaenau Gwent – £149,012 (-1.8% / +8.6%)
-
Bridgend – £228,346 (-0.8% / -1.6%)
-
Caerphilly – £198,979 (+1.3% / -0.7%)
-
Cardiff – £283,960 (-5.6% / -7.9%)
-
Carmarthenshire – £202,387 (-10.0% / -0.9%)
-
Ceredigion – £260,629 (-2.5% / -5.8%)
-
Conwy – £231,704 (-4.4% / +1.5%)
-
Denbighshire – £197,581 (-13.8% / -5.1%)
-
Flintshire – £252,092 (+12.4% / +8.5%)
-
Gwynedd – £234,111 (+2.2% / -8.8%)
-
Merthyr Tydfil – £154,263 (-12.4% / -1.6%)
-
Monmouthshire – £339,259 (-5.0% / +0.6%)
-
Neath Port Talbot – £160,450 (-6.8% / -4.1%)
-
Newport – £239,215 (-8.1% / -1.5%)
-
Pembrokeshire – £247,130 (-3.0% / -4.7%)
-
Powys – £244,875 (-10.8% / -2.5%)
-
Rhondda Cynon Taf – £171,376 (-1.2% / +2.7%)
-
Swansea – £233,374 (+1.9% / +6.8%)
-
Torfaen – £210,130 (-8.5% / +0.9%)
-
Vale of Glamorgan – £287,418 (-15.7% / -11.8%)
-
Wrexham – £210,917 (-7.5% / -1.2%)
House prices in Wales may have reached their lowest point
Head of Distribution at Principality Building Society, Shaun Middleton, said: “The downward trend of house prices has continued for the fifth consecutive quarter in Wales.
“Economic pressures, coupled with the higher cost of mortgages has meant affordability continues to be a problem for many buyers, placing undoubtable pressure on the housing market in Wales.
“The picture across Wales shows that overwhelmingly local authorities have been reporting price decreases, rather than increases, translating into another year-on-year falling of house prices.”
Most expensive UK cities to buy a house in
There were just under 8,400 transactions in Wales in the first quarter of 2024, 15% fewer than the last quarter of 2023.
This downward trend is reflected across the rest of the UK, with wider economic pressures facing the housing market acting as a major drag on demand and activity levels during the quarter.
In Wales, quarterly sales transactions have declined continuously year-on-year since late 2021, according to Principality.
But Mr Middleton said house prices have now reached their lowest point and next quarter they may begin to rise again.
RECOMMENDED READING:
He said: “Consumer confidence is also improving, along with wage growth, as pent-up demand for housing builds.
“Looking ahead, there may well be another fiscal event from the UK Government, but at the very least a General Election on the horizon, and a newly formed Welsh Government in Wales with a mandate to tackle affordable housing.
“Together with our insight, this suggests that this quarter may well represent the low point for house prices in Wales, which we expect to rise as affordability increases.”

Average asking prices for UK homes rose by 1.1% in April, hitting £372,324 despite a period of prolonged pressure on potential buyers from hiked interest rates.
The average monthly increase of £4,207 is in line with the 10-year average for this time of year, according to property website Rightmove’s (RMV.L) monthly house price index. The average price for a property coming to market for sale is now just £570 short of May 2023’s record of £372,894, while the annual rate of price growth increases to 1.7%, the highest level for 12 months.
The bump can be attributed to strength among prospective sales of the country’s most expensive homes, Rightmove said. The so-called “top-of-the-ladder” sector saw its strongest price growth since 2014.
“While some buyers, across all sectors, will feel that their affordability has improved compared to last year due to wage growth and stable house prices, others will be more impacted by cost of living challenges and stickier than expected high mortgage rates,” said Tim Bannister, Rightmove’s director of property science.
The market remains very price-sensitive, operating at different speeds across its many segments and areas, with prices and sales activity rising more slowly in the more mortgage-dependent, mass-market first-time buyer and second-stepper sectors, Rightmove said.
Read more: Five eco-friendly homes for Earth Day
The number of new sellers coming to the market is up by 12% compared to this time a year ago, and the number of sales being agreed is up by 13% as both seller and buyer activity rebound from last year’s much more subdued spring.
The top end of he market is significantly outpacing the average, with new sellers was up by 18% compared with last year, and the number of sales being agreed was up by 20%.
The moves come as bets ramp up on UK interest rate cuts, with forecasters at EY Item Club looking to a fall of 75bps in 2024, with the first cut to come in June.
In addition to this, EY is expecting 0.7% growth for 2024, a downgrade from the 0.9% previously predicted. However, 2025 growth predictions were upgraded from 1.8% to 2% as barriers to growth fall away. This includes falling inflation, higher consumer spending, and anticipated reductions in interest rates.
While it is uncertain whether Consumer Price Index (CPI) inflation will decline to the Bank of England’s 2% benchmark in April, due to sticky services inflation, the EY Item Club expects it to do so by the second half of 2024.
Watch: What is inflation? Yahoo U explains
Download the Yahoo Finance app, available for Apple and Android.
Jeremy Leaf, north London estate agent and a former chairman of the Royal Institution of Chartered Surveyors, said the housing market is still “playing catch-up” as the increase in new enquiries emboldens sellers to not only make their properties available, but chance their arm at higher asking figures.
He added: “The prospect of more stable or even falling mortgage rates is certainly helping to improve confidence generally.
“However, the uplift in supply has meant more choice, so the market remains price sensitive and buyers are negotiating hard – particularly those who require little or no finance.”
Rates peaked in July 2023, reaching 6.86pc, but have since fallen. The average two-year fix sits at around 5.83pc, while the average five-year fix is more like 5.40pc according to data firm Moneyfacts.
But in more recent times, mortgages have begun to edge up again as higher-than-expected inflation figures cast doubt over the likelihood the Bank of England will cut interest rates before the summer.
Tom Bill, head of UK residential research at Knight Frank, said changing economic predictions mean buyers and sellers “have faced mixed messages” this year, which may mean asking prices aren’t achieved.
He said: “While rising asking prices show seller expectations have improved, there is broader downwards pressure on prices as mortgage rates edge higher, supply increases and a wave of people roll off sub-2pc fixed-rate mortgages agreed in early 2022.
“The result is more friction around prices, particularly when a rate cut seems to move further into the distance with every release of economic data. That said, higher supply means there should be a recognisable spring bounce in the housing market.”
Nick Mendes, of mortgage brokerage John Charcol, said he had noticed a “slow down” of activity in recent weeks as mortgage rates stagnate and some buyers wait eagerly for a Bank Rate reduction.
He added: “We did see a lot of people entering the market earlier on in the year to beat the summer rush. Some house prices were reflecting the highs we saw just a few years ago.
“Some people will have stretched themselves, now unable to renew their rate in the current market and trying to downsize without losing on their property value.
“Always take asking prices with a pinch of salt; look at Land Registry prices for what [properties] were actually sold for.”

The growth of house sale prices in Nairobi slowed down in the first quarter of the year as the high cost of credit hit demand from home buyers.
Rental asking prices also expanded at a slower pace despite the fall in inflation during the period, indicating that the tough economic conditions are still weighing on the spending power of Kenyans.
A quarterly property index released by real estate firm HassConsult shows that house prices in the city and its satellite towns grew by 2.7 percent in the quarter, compared to 4.1 percent in the fourth quarter of 2023. Rents grew 0.4 percent, compared to 2.5 percent in the previous quarter.
The average price of mid- to upper-class properties in the city, covering all property types, stood at Sh35.9 million at the end of March 2024, according to the HassConsult data.
The average value of a four- to six-bedroom property stood at Sh39.7 million, while that of a one- to three-bedroom property was Sh13.1 million.
“The rise in asking prices moderated in the first quarter of the year as credit conditions tightened following the increase in the CBK’s base lending rate to 13 percent, which has had the effect of sweeping liquidity from the market,” said HassConsult head of development, consulting, and research Sakina Hassanali.
“Although inflation has fallen since the beginning of the year, the economy remains generally subdued, muting growth in rental yields to 6.9 percent in March from 6.7 percent in December 2023.”
The cost of bank credit rose in the quarter on the back of an increase in the base rate by the Central Bank of Kenya (CBK) to 13 percent in its February 2024 Monetary Policy Committee meeting, from 12.5 percent in December, and 10.5 percent in October 2023.
The rate increases were put in place by the CBK in an effort to bring down inflation and help the shilling reverse its depreciation against the dollar.
Banks in turn increased the cost of money in the economy, adjusting their lending rates in line with that of the CBK.
For property developers, a rise in the cost of credit directly impacts their pricing of property coming onto the market, since they have to service loans incurred when putting up the houses.
Buyers who rely on bank financing to make home purchases also face the direct impact of the adjusted rates.
In the suburbs, the highest price increase was seen in Ridgeways and Loresho at 2.9 percent and 2.7 percent, respectively, while in satellite towns, the top performing areas were Juja at 3.4 percent, Ngong at 2.7 percent, and Limuru at 2.2 percent.

A PROFESSIONAL property buying company says it has been left £20,000 out of pocket after the discover of a “home destroying” plant.
Jonathan Rolande is the director of House Buy Fast – a cash property buying company that looks to flick homes up for sale on to investors.
But one £56,000 South Wales purchase has gone haywire after they discovered a Japanese knotweed infestation after buying the home.
Rolande says the company has now lost £20,000 because of the noxious find.
Instead of being able to quickly sell the Aberdare home onto investors, House Buy Fast have now held the domicile for four years.
He told MailOnline: “Overnight it [the house] became in effect unsaleable, and at that point unmarketable.”
House Buy Fast has now forked out £3,500 to eradicate the plant and paid thousands more after having to hold the home.
Rolande said the company has had to pay £10,000 on servicing the debt they bought the house with, as well as thousands more on ensuring the home is fit for habitation to rent it out.
He said: “Luckily, it was a relatively cheaper house, so it didn’t completely destroy the business – but it could have done.
“If it was a very large property then we would have been in a bit of trouble with it.”
Rolande lays the blame for the bad purchase on the shoulders of the surveying company, who he says missed the weed.
He said it was “clear” that Japanese knotweed was present in the neighbouring property and at the home as well as it was coming up through the decking.
The weed can prevent buyers from getting a mortgage and homeowners are obliged under the law to control it.
The plant is incredibly fast growing and can grow a foot in a week.
It typically lies dormant during winter and then explodes into rapid growth in spring with bamboo looking stems and white flowers.
You could be fined £30,000 because of damaging Japanese knotweed
HOMEOWNERS could face a hefty £30,000 fine if there is Japanese knotweed – here’s how to make your garden safe.
Garden experts have issued a warning about the invasive plant as there are more than 50,000 infestations in the UK.
People are urged to be on the look-out for it this spring.
The co-founder of Power Sheds, Jack Sutcliffe, said: “It’s important to prevent them from spreading as soon as possible.
“The easiest way to do this is by spraying them with chemicals, digging them out or burning them.”
Japanese knotweed is one of Britain’s most invasive plants.
It is difficult to eradicate once it has become established.
The experts say it is important to bring in professional help to remove it, as even the smallest piece left in the ground can regrow.
Fines for the Japanese knotweed can go up to £34,000, but a recent lawsuit against a seller whose property had the plant came to £200,000.
Knotweed is very difficult to kill and it grows in most circumstances and climates.
After three years of treatment Rolande believes the plant has now been eradicated and says we wants to warn house buyers about the plant.
“You would be stuck there. If it’s a two bedroom house, and need another room because you have a child, you can’t sell.”
Now he second-guesses all the heart shaped leaves at his own home, worried he could have knotweed in his own garden.
Rolande said the previous homeowner had also not declared the knotweed when selling it.
It is unclear whether House Buy Fast have brought any legal action over the situation, despite laws covering the sale of a knotweed infested property.