
The Federal Home Loan Mortgage Corporation, better known as Freddie Mac, is predicting that home prices will rise much more modestly in 2024 and 2025 than its experts had previously estimated.
At the beginning of the year, Freddie Mac had forecasted that home prices would have increased by 2.8 percent in 2024 and by 2.0 percent in 2025 at the national level. But in its latest monthly outlook, published on Thursday, the government-sponsored corporation has dramatically changed its prediction.
According to Freddie Mac’s baseline scenario, home prices will increase by a much more modest 0.5 percent this year and in 2025.
“Under our baseline scenario, our housing outlook, particularly for home sales, remains subdued,” the corporation wrote.
Read more: First-Time Homebuyer Guide
“While housing demand is solid due to a large share of millennial first-time homebuyers looking to buy homes, they are challenged by high mortgage rates and a lack of homes available for sale.”
ANDREW CABALLERO-REYNOLDS/AFP via Getty Images
Freddie Mac expects these challenges to continue throughout 2024 “mainly in the absence of significant rate cuts, which will keep the rate-lock effect in place and keep total home sales volume below five million in 2024.”
Newsweek previously reported about the impact that millennials are having on the housing market, where they’re unwillingly contributing to keeping prices high.
The generation born between 1981 and 1996 has been waiting years for the right moment to buy only to see the financial crisis of 2007-2008 followed by the COVID-19 pandemic. Many got tired of waiting, and they’re now trying to get on the property ladder en masse, shaking up the entire market.
Read more: How to Get a Mortgage
This pent-up demand for homes is keeping prices high, especially as the U.S. is still suffering from a historic lack of inventory, and mortgage rates, which are currently averaging 6.8 percent, remain high. The result is that many homebuyers are still being squeezed out of the market—as recent sales data show.
The latest report on existing-home sales by the National Association of Realtors (NAR), published on Thursday, found that existing-home sales descended 4.3 percent in March from February. Compared to a year before, they dropped 3.7 percent. At the same time as sales dropped, prices climbed: between February and March, the median existing home sale price rose 4.8 percent to $393,500.
Matthew Walsh, Moody’s Analytics housing economist, told Newsweek that, as expected by Freddie Mac, home sales are expected to remain low throughout 2024.
“Extremely low housing affordability and a lean existing sales inventory will keep a lid on existing-home sales in the coming months,” he told Newsweek.
“Sales remain well below their average over the past decade, and forward-looking indicators are downbeat. The National Association of Realtors’ pending home sales index had an uneven showing to start the year, and is averaging near its record low. Similarly, mortgage purchase applications have moved sideways over the last few weeks.”
Uncommon Knowledge
Newsweek is committed to challenging conventional wisdom and finding connections in the search for common ground.
Newsweek is committed to challenging conventional wisdom and finding connections in the search for common ground.

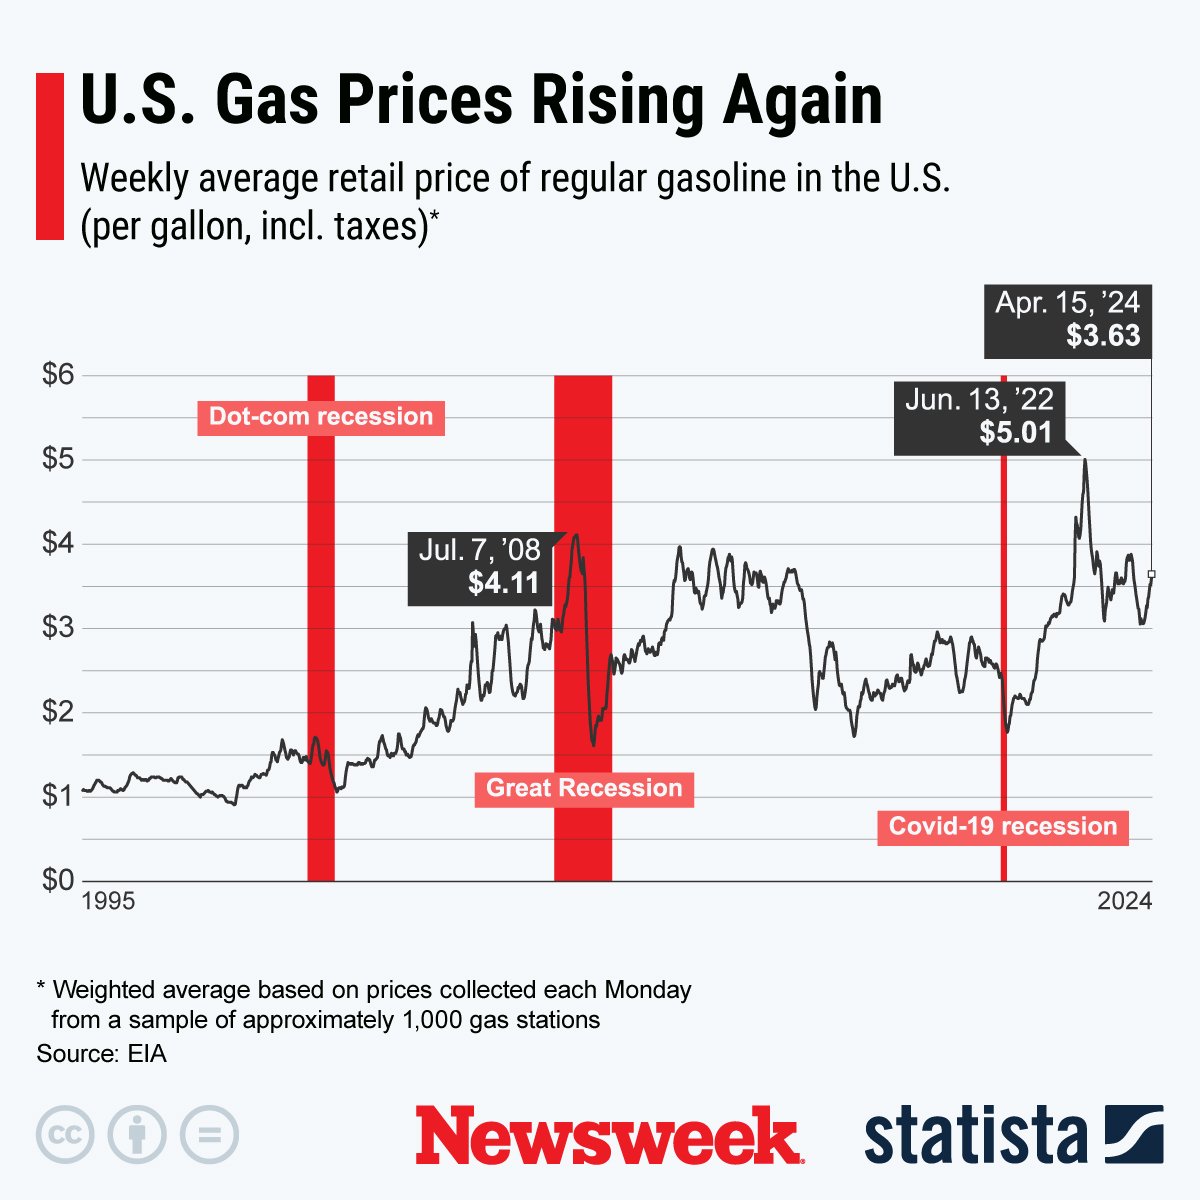
White House press secretary Karine Jean-Pierre‘s comment about gas prices currently remaining well below their 2022 peak has sparked backlash among conservatives on social media and other users complaining that fuel is still “way overpriced.”
During a press briefing on Monday, Jean-Pierre responded to a question by a reporter asking about the increase of gas prices across the country over the last month and what the Biden administration was going to do about it.
Read more: Best Credit Cards to Save on Gas
“I don’t have any new actions to read out,” Jean-Pierre said. “I would say that gas prices remain well below their peak back in 2022, I think that’s important. The average gas price right now is cheaper than this time last year, and that’s because of what this president has been doing over the last three years.”

FREDERIC J. BROWN/AFP via Getty Images
As of Tuesday, the national average price for gas was $3.644 per gallon, according to the American Automobile Association (AAA), up from $3.634 the day before and $3.608 a week before. A month ago, on March 16, the national average gas price was $3.455 per gallon. Compared to a year ago, gas prices are slightly lower: on April 16, 2023, the national average was $3.669 per gallon.
The Republican National Committee shared a clip of the press briefing on X, formerly known as Twitter, writing that “gas prices are up almost 52 percent since Biden took office.”
Another social media user on the platform wrote: “Used to be 2 bucks. Now it’s over 3 bucks. The fact that it’s not 4 bucks anymore doesn’t change the fact it’s still high.” Another wrote that gas prices were “still way overpriced.”
A user who described herself as an “old-school conservative” wrote: “Karine Jean-Pierre praises the current gas prices, even after being told they’ve gone up 20¢/gallon in just the past month. Are you impressed by gas prices under Biden?”
When Biden took office in January 2021, gas prices were an average of $2.4 per gallon across the country, according to the U.S. Energy Information Administration (EIA). By December of the same year, they had risen to over $3 per gallon, and in June 2022, they reached a peak of $5.06 per gallon due to the hardships caused in part by the Russian invasion of Ukraine.
Statista
This chart, provided by Statista, shows the weekly average retail price of regular gasoline in the U.S. (per gallon, including taxes).
Gas prices, whose vertiginous climb contributed to the rise of inflation between 2022 and 2023, have recently been climbing across the country, raising concerns that they will discourage the Federal Reserve from cutting interest rates. According to Charlie Bilello, chief market strategist at Creative Planning, gas prices have jumped by 17 percent so far this year, nearing their highest level since October 2023.
But while the rise in gas prices is bad news for U.S. drivers, their growth is not totally unexpected. It’s common for the cost of gas to increase as the weather gets warmer and people are eager to get on the road, between March and April, and peak at the beginning of summer in June.
Patrick De Haan, head of petroleum analysis at GasBuddy, wrote on X that the rise in gas prices “was completely expected and where we are today is not a surprise at all.” In its outlook for 2024, GasBuddy predicted that the highest prices this year will be reached at the peak of the summer driving season in May, with the national average potentially rising as high as $3.89 per gallon.
Newsweek contacted De Haan for comment by email on Tuesday morning.
“The record gasoline average of $5.04/gal in June 2022 will not be repeated this year, with few caveats,” De Haan said.
Uncommon Knowledge
Newsweek is committed to challenging conventional wisdom and finding connections in the search for common ground.
Newsweek is committed to challenging conventional wisdom and finding connections in the search for common ground.
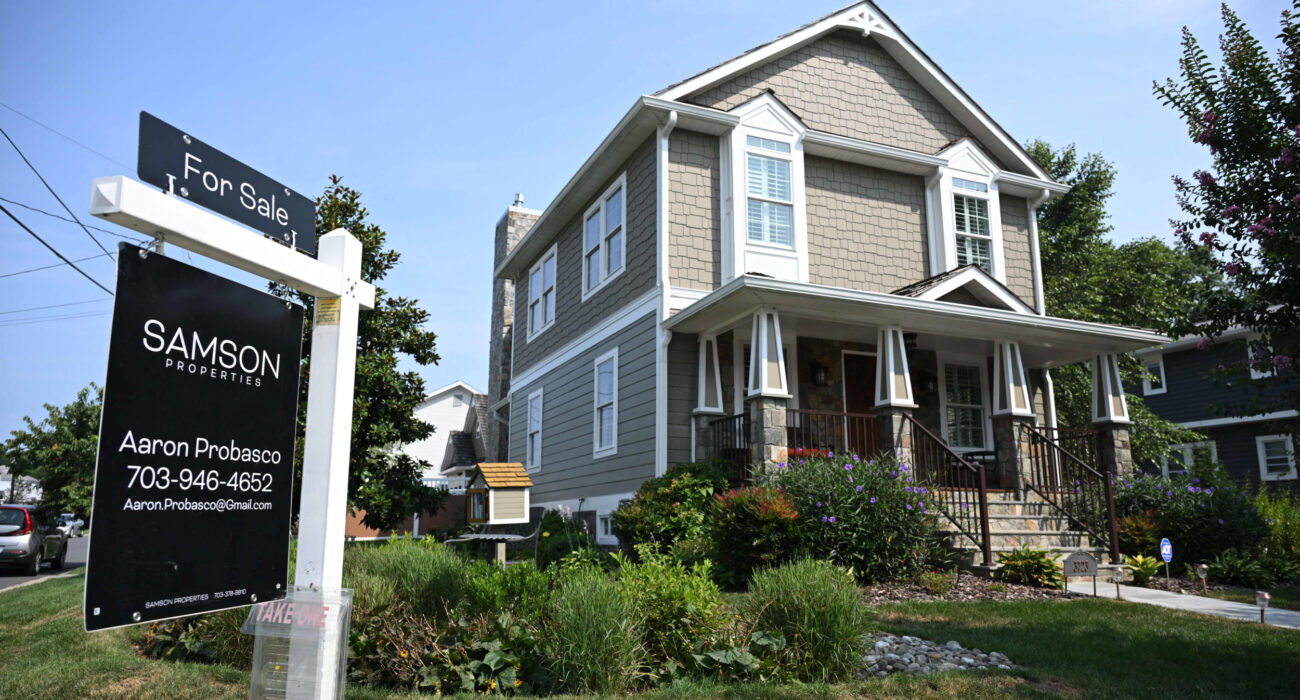
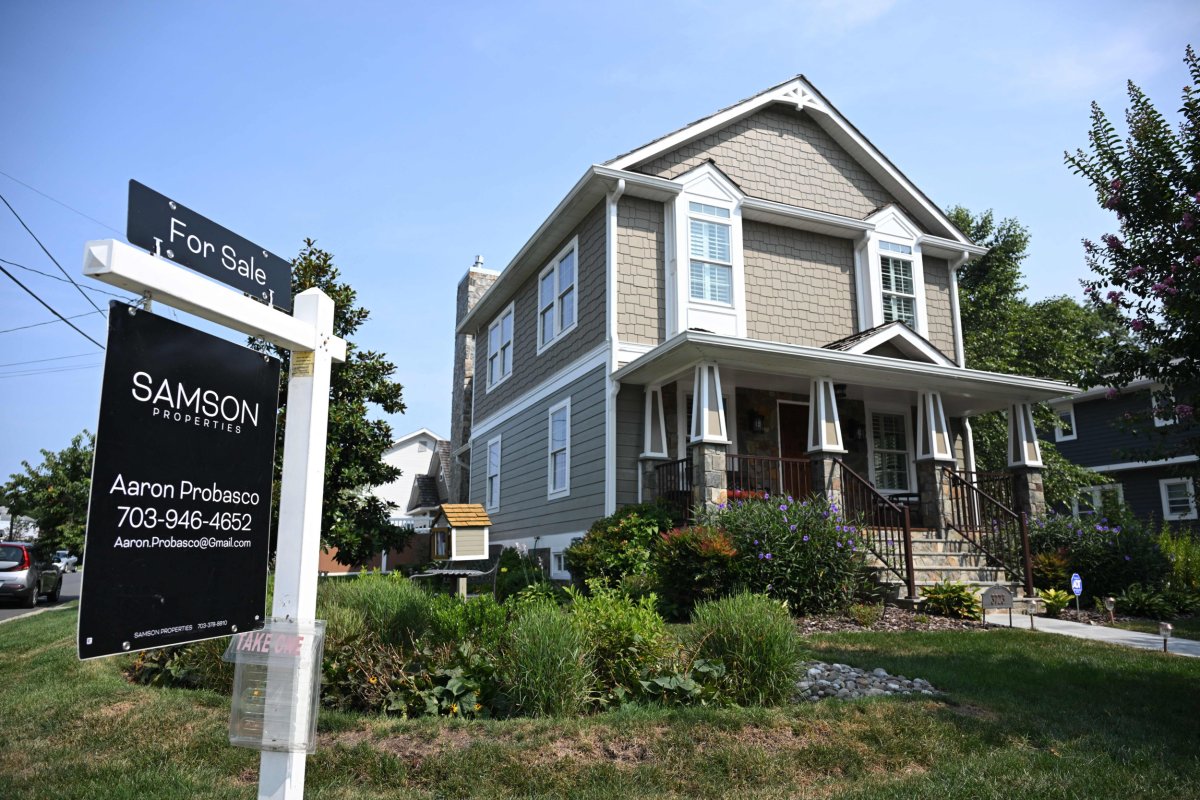
A rising number of homes for sale in Florida are seeing sellers slashing prices in an attempt to offload their properties quickly, according to the latest data available on real estate site Zillow.
Newsweek reported last week that, as of early on Monday, March 4, there were 47,335 homes listed on Zillow with a price reduction out of a total of 202,463 properties listed by agents on the real estate marketplace. Among properties listed by owners or others, 1,167 out of 8,654 had a price reduction.
As of this Monday, the number of Florida properties for sale on Zillow with a price reduction has grown to a total of 48,695 homes listed by agents and a slight fall to 1,125 for properties listed by owners and others.
The jump in the percentage of homes on sale with a price reduction is nearly as large as the increase in homes for sale in the past week in total. There were 204,222 properties listed for sale by agents and 8,857 listed by owners and others. This number included all properties, counting townhomes, apartments, condos, lots and lands, single-family and multi-family homes.
Joe Raedle/Getty Images
While Florida generally has a higher number of properties for sales than most other states, because of its size and the number of vacation homes on the market, the state has seen an increase in activities in recent months, experts told Newsweek.
This increase, according to Florida Realtors chief economist Brad O’Connor, is likely linked to the fact that many homeowners in the Sunshine State who had been avoiding selling their properties because of high mortgages now believe rates won’t climb any further.
“I think people are now more comfortable with the fact that interest rates are up here to stay,” O’Connor previously told Newsweek. “I think initially when rates rose quickly, people were uncertain as to where they would go from there. But now we’re pretty much in a situation where I think everyone is comfortable with the idea that rates are probably going to stay about where they’re at, or they’re going to decline somewhat in the next year or two.”
Lawrence Yun, chief economist and senior vice president of research at the National Association of Realtors, previously told Newsweek that many homeowners are likely trying to take advantage of the high home price appreciation the state has experienced in the past three years.
“Some people may be cashing out,” Yun said, adding that skyrocketing insurance premiums might also have played a role in pushing people to sell. “Property insurance readjustments—like any other added cost of ownership—will induce some additional sellers,” he said. “Some retired homeowners on fixed income could be forced to sell.”
Home insurance premiums have climbed by 102 percent in the past three years, according to the Insurance Information Institute, as the risk of extreme weather events is growing with climate change and several private insurers have pulled out of the state or stopped offering new policies.
Uncommon Knowledge
Newsweek is committed to challenging conventional wisdom and finding connections in the search for common ground.
Newsweek is committed to challenging conventional wisdom and finding connections in the search for common ground.

For a large number of millennials, the generation born between 1981 and 1996, the time to buy a home has never been quite right.
Older millennials were not yet 30 when the financial crisis of 2007-2008 upended the housing market and the US economy, causing the worst downturn in the country since the Great Recession. When younger millennials came of age to buy a home, the US housing market was booming, driven by high demand and low inventory, with prices reaching heights that made properties unaffordable to many.
Despite adverse economic conditions, and tired of waiting for the perfect moment, many got on the property ladder anyway—and their late arrival has shaken up the entire housing market, according to experts.

Photo-illustration by Newsweek/Getty
“Because of the high cost of living, millennials have had to delay marriage, they’ve had to delay having children. So what’s going on is that there’s been a delay in household formation, though right now the rate of household formation is double the rate of population growth,” Phil Powell, executive director of Indiana University’s Business Research Center, told Newsweek.
“What that means is that there is unprecedented demand for housing and that is why housing prices are going up,” he added. Millennials, said Powell, “are putting upward pressure on prices and it’s going to continue, it’s not a fad or some bubble in the housing market. This is real, it’s demographic.”
They’re also not the only generation keeping prices up.
Alejandra Grindal, chief economist at Ned Davis Research, told Newsweek that baby boomers (those born between 1946 and 1964) are also adding price pressure. “They are the second-largest age cohort in the U.S., and they’re also driving up demand, partly because they can afford to,” she said. Millennials, in 2020, overtook baby boomers to become the largest generation in the U.S.
“Compared to prior generations,” she added, “[Baby boomers] also plan on staying in their homes much longer. They don’t want to go to assisted living or nursing care. They want to live in their homes as long as possible. Plus a lot of them would like to own second homes.”
Older Buyers, Higher Prices
Waiting for a better, cheaper time to buy a home, in 2022 millennials brought up the average age of a first-time buyer to 36, according to the National Association of Realtors, from 33 in 2021.
Sara Coers, a lecturer in real estate at Indiana University, said this generation waited because “they have been much more tolerant of renting, whereas previous generations were much more insistent upon homeownership.” They have also accepted the fact that they have to pay a much higher price for a home than their parents did.
“They are really the victims of freak circumstances,” Coers told Newsweek. “We overbuilt prior to the last recession and the capital markets, the lenders, the banks thought we didn’t really want to build new homes after that. They weren’t paying attention to the future of household formation. And we dramatically undersupplied the country.”
For Coers, millennials are a “disruptive generation” because of their size and their record household formation rates, which have clashed with a record undersupply of housing, the result of the last recession. “And that has led to some extreme buying behavior,” she said.
Unfortunately, experts say the future still looks bleak for millennials.
“If I’m a millennial household, I either have to allocate more money to savings or reduce my expectations,” Powell said. “It’s the brutal reality of supply and demand. Millennials are saddled with higher real costs of college than their parents and with higher housing costs. It’s going to continue to be bad for several years.”
In the near future, more millennials are going to look into buying a home, Coers said, “bringing up demand as the market works through that generation.”
Coers thinks that it’s likely that the U.S. will build a lot of homes to catch up with the millennial generation “and then there will be smaller generations coming forward and that will hopefully regulate the housing market, because lack of affordability has become a huge problem.”
Grindal added that millennials are also changing the profile of homeowners in the U.S., with “more single-person buyers” while it used to be more common for married couples to buy a home.
“Maybe that whole notion of having to get married and start a family doesn’t really have to precede wanting to buy a home,” she said.
More Diverse Homeownership
It’s not all doom and gloom when it comes to millennials taking over the housing market. According to a recent NAR study, the increase in homeownership among millennials comes with an increase in homeownership among minorities.
Over the next five years, according to the NAR report, released on February 13, 1.5 million Black households are expected to turn the median homebuying age, at the same time as 775,000 Asian households and 2.2 million Hispanic households.
“Millennials and Generation Z are more racially and ethnically diverse. While all first-time buyers are facing challenges in entering into homeownership, as more young buyers enter into the homebuying market, there will be a rise in minority owners,” Jessica Lautz, deputy chief economist and vice president of research at NAR, told Newsweek.
In 2022, according to the NAR report, there were 10.5 million more homeowners than 10 years before, with all ethnic groups having increased their homeownership rates. Asian Americans increased their homeownership rates by 6.1 percent between 2012 and 2022, while Hispanic homeownership grew by 5.4 percent. White homeownership increased by 3.1 percentage points, while Black homeownership rose by only 1.6 percent.
A Future Bubble
For Grindal, the big question surrounding the future of the housing market is about supply. “It comes from two sources,” she said. “Existing supply and people willing to leave their current homes. And as we’ve said, baby boomers are not going to unleash new supply to the next generations very soon.”
On top of that, now that mortgage rates are higher, homeowners who have secured lower rates are likely to hold on to their homes. “That’s keeping the home supply pretty contracted,” Grindal said.
For Powell, the upward trend in home prices, now mainly driven by millennials’ demand, will continue for the next five to 10 years. “The only break we can get on housing prices is if they build more houses,” he said.
In the long-term, millennials can expect to be hit by yet another blow. While they are likely to buy homes at a very high price now because of low supply and high demand, when they’ll be ready to sell their house in 20 years they’ll likely face a drop in demand in the market, driven by demographic decline, which will cause their properties to lose value.
“The housing bubble is going to be in 10-20 years, at the end of the life of baby boomers, when they finally put their houses on the market.”
In a study published by Indiana University, Powell and Coers wrote that a generational housing bubble is on the horizon. “New housing built now to meet strong demand may sit vacant in a decade. Demand reversal will intensify by the mid-2030s when the annual number of homes that seniors add back to the market is expected to be 40 percent higher than current levels,” the researchers wrote.
Uncommon Knowledge
Newsweek is committed to challenging conventional wisdom and finding connections in the search for common ground.
Newsweek is committed to challenging conventional wisdom and finding connections in the search for common ground.

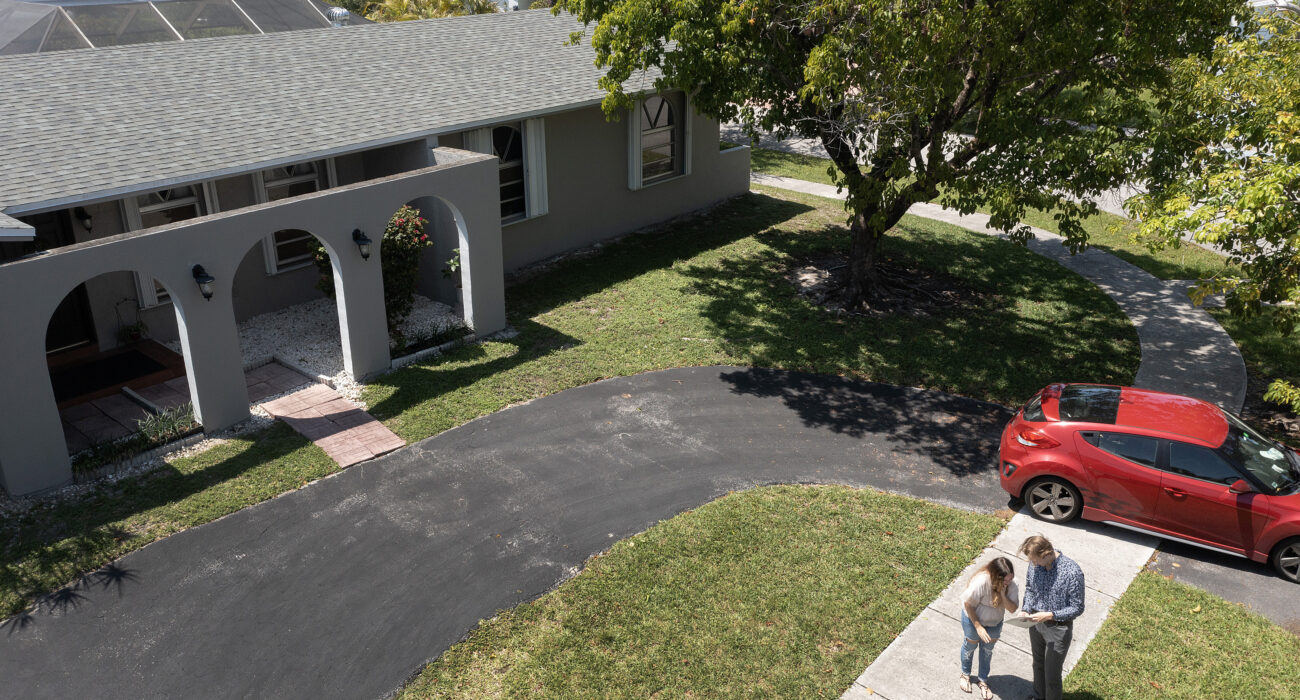
Home prices have fallen in most of the country’s 50 largest metropolitan housing markets in the past month, according to the latest data from Zillow, despite inventory remaining historically low and keeping prices relatively high.
According to the real estate listing and brokerage website’s Zillow Home Value Index (ZHVI), which provides a seasonally adjusted measure of home values in the U.S., prices have fallen in 45 out of the 50 metro areas examined by the company month-over-month in January 2024.
Though it may not be good news for homebuyers just yet.
Journalist Lance Lambert, who compiled the data—without seasonal adjustment—for Residential Club, shared on X, formerly known as Twitter, a table showing the changes in prices in the 50 metro areas.
#NEW Zillow home price data for America’s 50 largest metropolitan housing markets
1. MoM (month over month)
2. YoY (year over year)
3. Shift since 2022 peak
4. Shift since March 2020Without seasonal adjustment, through January 2024
Chart via @ResidentialClub pic.twitter.com/fxq0bfx9gy
— Lance Lambert (@NewsLambert) February 16, 2024
According to the ZHVI, home values fell in the following metro areas between December 2023 and January 2024.
- Hartford, CT (-0.2 percent)
- Providence, RI (-0.5 percent)
- Boston, MA (-0.4 percent)
- Los Angeles, CA (-0.1 percent)
- San Jose, CA (-0.1 percent)
- Milwaukee, WI (-0.6 percent)
- Philadelphia, PA (-0.2 percent)
- Cleveland, OH (-0.7 percent)
- Buffalo, NY (-0.7 percent)
- Chicago, IL (-0.4 percent)
- Columbus, OH (-0.3 percent)
- Cincinnati, OH (-0.4 percent)
- Virginia Beach, VA (-0.2 percent)
- Detroit, MI (-0.5 percent)
- St. Louis, MO (-0.5 percent)
- Kansas City, MO (-0.2 percent)
- Pittsburgh, PA (-0.6 percent)
- Richmond, VA (-0.3 percent)
- Louisville, KY (-0.5 percent)
- Washington, D.C. (-0.2 percent)
- Baltimore, MD (-0.3 percent)
- Charlotte, NC (-0.3 percent)
- Atlanta, GA (-0.3 percent)
- Orlando, FL (-0.2 percent)
- Oklahoma City, OK (-0.3 percent)
- Seattle, WA (-0.3 percent)
- Tampa, FL (-0.5 percent)
- Phoenix, AZ (-0.2 percent)
- Indianapolis, IN (-0.2 percent)
- Sacramento, CA (-0.3 percent)
- Raleigh, NC (-0.3 percent)
- Portland, OR (-0.4 percent)
- San Francisco, CA (-0.6 percent)
- Minneapolis, MN (-0.8 percent)
- Birmingham, AL (-0.6 percent)
- Denver, CO (-0.4 percent)
- Nashville, TN (-0.4 percent)
- Salt Lake City, UT (-0.5 percent)
- Memphis, TN (-0.6 percent)
- Houston, TX (-0.1 percent)
- Dallas, TX (-0.2 percent)
- Jacksonville, FL (-0.6 percent)
- San Antonio, TX (-0.5 percent)
- Austin, TX (-0.6 percent)
- New Orleans, LA (-1.1 percent)
Home values went up month-over-month in January only in San Diego, CA (0.2 percent), New York, NY (0.1 percent), Riverside, CA (0.2 percent), and Las Vegas, NV (0.1 percent). In the metro area of Miami, FL prices were unchanged.
Newsweek contacted Zillow for comment by email on Monday early morning.
These modest drops are not necessarily good news for aspiring homebuyers. Lambert commented on the data saying that “it’s normal for January prices to be down a little month-over-month,” while February and March “is when the seasonal pickup usually starts in this type of data line.”

Mario Tama/Getty Images
The situation is different when considering the year-over-year scenario, with 47 of the 50 largest markets in the U.S. being higher in January 2024 and only Austin, San Antonio and New Orleans still falling. These cities, which were once considered pandemic boomtowns, have seen some of the most dramatic price corrections in the months between late summer 2022 and spring 2023, and continue to see home values falling.
The recent data for the largest metro areas in the U.S. reflects the situation in the entire country. The average home value in the U.S., according to Zillow’s latest data, was $342,941 as of January 31, 2024—up 3.1 percent year-over-year and 0.12 percent from the previous month.
Uncommon Knowledge
Newsweek is committed to challenging conventional wisdom and finding connections in the search for common ground.
Newsweek is committed to challenging conventional wisdom and finding connections in the search for common ground.

The bank’s Tokyo-listed shares fell for a second day, tracking losses in U.S. regional lenders overnight.
The commercial lender said Thursday it expects to post a net loss of 28 billion Japanese yen ($191 million) for the fiscal year ending March 31, compared with its previous outlook for a net profit of 24 billion yen. The bank forecast a net profit of 17 billion yen for the next fiscal year.
“Aozora is a major mid-tier lender whose strength lies in its relationships with real estate/business revitalization financing companies and regional financial institutions,” Goldman Sachs analysts wrote in a Friday note.
They retained their sell rating on Aozora’s shares with a price target of about 2,460 yen per share, mainly due to the short to medium outlook for the bank’s profits.
Aozora said Thursday it expects its Common Equity Tier 1 ratio, which compares a bank’s capital against its assets, to fall to 6.6% by the end of the current fiscal year, temporarily dipping below its 7% target.
“There have been some concerns in recent years over a decline in the CET1 ratio due to deterioration in U.S. commercial real estate credit costs and valuation losses on available-for-sale securities,” Masahiko Sato, a senior analyst with SMBC Nikko Securities, wrote in a Thursday note to clients.
“How this will impact other banks is another question,” Sato added. “U.S. real estate lending for around 10% of (its) total lending with a CET1 ratio of below 7% due to unrealized losses on securities has no precedent.”
Aozora’s update came shortly after U.S. regional bank New York Community Bancorp announced a surprise net loss of $252 million for the fourth quarter.
NYCB also slashed its dividend and said it had “[built] reserves during the quarter to address weakness in the office sector” — renewing some fears over the strength of U.S. regional banks, which were embroiled in a liquidity crisis last year.
The lender said this was in response to its purchase of the assets of Signature Bank, one of the regional banks that collapsed in last year’s crisis. That purchase raised their total assets to $100 billion, placing them in a category that subjects the bank to more stringent liquidity standards.
Bank of America analysts said in a Wednesday note that the sell-off in U.S. regional banking shares on contagion fears is “likely overdone given idiosyncratic factors tied to NYCB.”
“However, higher losses tied to commercial real estate office exposure, increase in criticized loans tied to multi-family CRE [commercial real estate] are a reminder of ongoing credit normalization that we are likely to witness across the industry,” Bank of America U.S. banking analysts wrote.
“It is worth pointing out that the credit/liquidity build at NYCB are mostly the bank playing catch-up to actions taken by larger regional peers over the last year,” they added.
— CNBC’s Michael Bloom contributed to this story.

Home prices in the U.S. went down 0.2 percent between October and November 2023, the first monthly drop since January of the same year, according to the S&P CoreLogic Case-Shiller national home price index.
According to the latest data released by S&P Dow Jones Indices on Tuesday, 12 out of the 20 major metro markets analyzed by the company reported month-on-month price declines. The metro areas which experienced a drop in prices are Boston (-0.2 percent), Chicago (-0.4 percent), Dallas (-0.6 percent), Denver (-0.9 percent), Detroit (-0.4 percent), Minneapolis (-0.8 percent), Phoenix (-0.3 percent), Portland (-1.0 percent), San Diego (-0.5 percent), San Francisco (-1.3 percent), Seattle (-1.4 percent) and Washington (-0.3 percent).
“U.S. home prices edged downward from their all-time high in November,” Brian D. Luke, head of Commodities, Real & Digital Assets at S&P DJI, said. “The streak of nine monthly gains ended in November, setting the index back to levels last seen over the summer months. Seattle and San Francisco reported the largest monthly declines, falling 1.4 percent and 1.3 percent, respectively.”

FREDERIC J. BROWN/AFP via Getty Images
“This month’s report revealed the narrowest spread of performance across the nation since the first quarter of 2021,” Luke added.
“The days of markets in the South rising double digits with markets in the Midwest remaining flat are over. The house price decline came at a time where mortgage rates peaked, with the average Freddie Mac 30-year fixed rate mortgage nearing 8 percent, according to Federal Reserve data,” he continued. “The rate has since fallen over 1 percent, which could support further annual gains in home prices.”
Home prices grew month-over-month in November 2023 in Charlotte (0.2 percent), Cleveland (0.3 percent), Las Vegas (0.2 percent), Los Angeles (0.1 percent), Miami (0.3 percent), New York (0.3 percent) and Tampa (0.1 percent).
Prices nationally were still higher when compared to a year before, rising 5.1 percent from November 2022 and up from a 4.7 percent increase in October 2023. Detroit reported the highest year-over-year increase in the country at 8.2 percent in November, with home prices in the city going up for the third month in a row. San Diego followed with an 8 percent increase.
Six cities registered a new all-time high in November, including Miami, Tampa, Atlanta, Charlotte, New York and Cleveland, according to Luke.
Portland was the only city where home prices dropped year-over-year, with a decrease of 0.7 percent between November 2022 and November 2023.
Update 01/30/2024, 10:40 a.m. ET: This article was updated with more details.
Uncommon Knowledge
Newsweek is committed to challenging conventional wisdom and finding connections in the search for common ground.
Newsweek is committed to challenging conventional wisdom and finding connections in the search for common ground.
How does the Consumer Price Index account for the cost of housing?
This piece was originally published in May 2022. It has since been updated.
Housing represents about one-third of the value of the market basket of goods and services that the Bureau of Labor Statistics (BLS) uses to track inflation in the Consumer Price Index (CPI). A rise in the cost of housing—what the BLS calls shelter—contributed to high inflation in 2022 and 2023. Measuring changes in shelter costs is more difficult than measuring changes in everyday prices like groceries and gasoline. This post explains how the BLS measures changes in the cost of housing for renters and homeowners in the CPI.
How does the BLS calculate the price of shelter?
For rental properties, the BLS counts cash rent paid to the landlord for shelter and included utilities, plus any government subsidies paid to the landlord on the tenant’s behalf. If a unit is owner-occupied, the BLS computes what it would cost to rent that home in the current housing market, known as Owners’ Equivalent Rent (OER). Utilities paid by homeowners are measured separately in the CPI.
Why does the BLS use OER instead of house prices?
The CPI aims to capture the change in the prices of goods and services consumed by households over time. For housing, the BLS wants to capture the change in the consumption value of a home—the price of the shelter it provides—not the change in the value of the home outright. Therefore, the BLS uses changes in the rental value (the OER) to measure the cost of shelter for homeowners. For example, if a family buys a house for $300,000 in 2024 and lives there for 10 years, their shelter consumption is not $300,000 in 2024, and zero in subsequent years—nor is it their monthly mortgage payment, which will vary based on their down payment, the maturity of the loan, and the interest rate at the time they purchased the house. Rather, their shelter consumption is the amount they would have spent to consume the same amount of housing services provided by their owner-occupied home.
Where does the BLS get data on shelter prices?
The BLS collects rent data for about 40,000 residences through personal visits or telephone calls. The sample is divided into six panels, each of which is sampled every six months on a staggered basis. The first panel is sampled in January and July, the second in February and August, and so forth. Since rents don’t usually change frequently, comparing samples over six months allows the BLS to pick up more meaningful changes. One panel is replaced each year to keep the housing sample representative.
The CPI measures price growth for the same basket of goods and services over time, so the BLS adjusts for changes in the quality of housing over time. The adjustments account for the age of the property, neighborhood improvements, and physical renovations to the home like a new bathroom or air conditioning system.
The BLS uses rent data to impute OER based on rents for comparable rental housing in the area.
What are the potential problems with the estimation of OER?
Finding rental housing that is comparable to an owner-occupied unit can be difficult. Predominantly renter-occupied neighborhoods are often geographically separate from owner-occupied ones—consider a city center versus a suburb. Even within the same area, housing characteristics can vary widely across rental and owner-occupied units—for example, the owner-occupied units in a neighborhood may be single-family homes, while the rental units may be multi-family buildings. Finding comparable rental housing is particularly difficult for large, expensive single-family homes.
Why are rents in the CPI rising much faster than market rents in early 2024?
The measure of the rents in the CPI tends to lag well-known indices of market rents like the Zillow Observed Rent Index and the CoreLogic Single Family Rent Index. CPI rent inflation rose only moderately in 2022, while market rents were soaring (see figure). More recently, CPI rent inflation has been much higher than Zillow and CoreLogic rent inflation.
This lag occurs for a few reasons. First, the market indices capture rents of units currently on the market, not rents for units occupied by continuing renters, like the CPI does. Rents change when leases expire, which typically happens annually. In addition, landlords may be less likely to raise rents to market prices for continuing tenants, and so it might take even longer for rents on all units to catch up with rents charged to new tenants. Second, because the BLS only examines rents every six months, it can’t know exactly when the rent changed. The BLS assumes that the rent increased gradually over the six months, meaning that only about one-sixth of the total observed increase in rent is attributed to the month the unit is sampled.1 For example, if the BLS observed that rent increased from $2,000 per month in January 2022 to $2,400 per month in July 2022—a 20% increase—it would assume that the increase in rent in July 2022 for that unit was 3%, roughly one-sixth of 20%. That means that an unusual increase in rents will only fully show through with a lag in the CPI.
In late 2022, researchers at the BLS and Cleveland Fed introduced an experimental quarterly index of new tenant rent (New Tenant Rent Index) using a very similar method to the Zillow index and data from the CPI Housing Survey. This index tracks market rents by only using observations in the CPI dataset that follow a change in tenant. The New Tenant Rent Index accounts for changes in the price of utilities, depreciation, and remodeling between tenants. Like the Zillow and CoreLogic indices, the New Tenant Rent Index will likely be a leading indicator for the shelter component of CPI.
Indicators of market rents, including Zillow, CoreLogic, and the New Tenant Rent Index, show that rent inflation for new tenants is at or below pre-pandemic levels, while CPI rent inflation remains elevated. This suggests that CPI rent inflation will decline over 2024 or 2025.
How do house prices affect the CPI measure of homeownership costs?
House prices and rental prices are determined by supply and demand factors that don’t always move in tandem. For example, if demand for houses rises because mortgage rates fall, house prices will rise but rents will not. If construction costs increase, on the other hand, the price of both rental and owner-occupied housing would likely rise.
Over time, changes in house prices do predict changes in rents—although the relationship is far from one-to-one and occurs with long lags. Xiaoqing Zhou and Jim Dolmas of the Dallas Fed find that the correlation between house price growth and OER inflation peaks at about 0.75 after 16 months.
Source link