
Aalbers, M. B. Financial geography II: financial geographies of housing and real estate. Prog. Hum. Geog. 43, 376–387 (2019).
Fuller, G. W., Johnston, A. & Regan, A. Housing prices and wealth inequality in Western Europe. Western European Politics 43, 297–320 (2020).
Nieuwenhuis, J., Tammaru, T., van Ham, M., Hedman, L. & Manley, D. Does segregation reduce socio-spatial mobility? Evidence from four European countries with different inequality and segregation contexts. Urban Studies 57, 176–197 (2020).
Baker, E., Bentley, R., Lester, L. & Beer, A. Housing affordability and residential mobility as drivers of locational inequality. Applied Geog 72, 65–75 (2016).
Hochstenbach, C. & Musterd, S. Gentrification and the suburbanization of poverty: changing urban geographies through boom and bust periods. Urban Geog 39, 26–53 (2018).
Braubach, M. & Fairburn, J. Social inequities in environmental risks associated with housing and residential location–a review of evidence. European Journal Public Health 20, 36–42 (2010).
Furszyfer Del Rio, D. D., Sovacool, B. K., Griffiths, S., Foley, A. M. & Furszyfer Del Rio, J. A cross-country analysis of sustainability, transport and energy poverty. npj Urban Sustainability 3, 1–18 (2023).
Rey-Blanco, D., Zofío, J. L. & González-Arias, J. Improving hedonic housing price models by integrating optimal accessibility indices into regression and random forest analyses. Expert Systems with Applications 235, 121059 (2024).
Chau, K. W. & Chin, T. L. A critical review of literature on the hedonic price model. International Journal for Housing Science and its Applications 27, 145–165 (2002).
Lan, F., Wu, Q., Zhou, T. & Da, H. Spatial effects of public service facilities accessibility on housing prices: a case study of Xi’an, China. Sustainability 10, 4503 (2018).
van Ham, M., Manley, D. & Tammaru, T. “Geographies of Socio-Economic Inequality.” IZA Discussion Paper No. 15153, 0–17 (2022).
Rolnik, R. Urban warfare: housing under the empire of finance. Google-Books-ID: mnCKDwAAQBAJ (Verso Books, 2019).
Goda, T., Stewart, C. & Torres García, A. Absolute income inequality and rising house prices. Socio-Economic Review 18, 941–976 (2020).
Fadda, S. & Tridico, P. Inequality and uneven development in the post-crisis world (2017).
Hochstenbach, C. & Arundel, R. Spatial housing market polarisation: national and urban dynamics of diverging house values. Transactions of the Institute of British Geographers 45, 464–482 (2020).
Sabater, A. & Finney, N. Age segregation and housing unaffordability: generational divides in housing opportunities and spatial polarisation in England and Wales. Urban Studies 60, 941–961 (2023).
López, I. & Rodríguez, E. New left review 69, May-June 201. In New left review (2011).
Gil García, J. & Martínez López, M. A. State-led actions reigniting the financialization of housing in Spain. Housing, Theory, Society 40, 1–21 (2023).
Fernandez, R. & Aalbers, M. B. Financialization and housing: between globalization and varieties of capitalism. Competition and Change 20, 71–88 (2016).
Leal, J. & Sorando, D. Economic crisis, social change and segregation processes in Madrid. In Socio-Economic Segregation in European Capital Cities: East Meets West, 214–237 (2015).
López-Gay, A., Andújar-Llosa, A. & Salvati, L. Residential mobility, gentrification and neighborhood change in spanish cities: a post-crisis perspective. Spatial Demography 8, 351–378 (2020).
Romanos, E. Full article: evictions, petitions and escraches: contentious housing in austerity Spain. Social Movement Studies 13, 296–302 (2013).
Raya, J. M. The determinants of foreclosures: evidence from the Spanish case. Papers in Regional Science 97, 957–970 (2018).
Sorando, D., Uceda, P. & Domínguez, M. Inequality on the increase: trajectories of privilege and inequality in Madrid. Journal of Social Inclusion 9, 104–116 (2021).
Parreño-Castellano, J. M., Piñeira-Mantiñán, M. J. & González-Pérez, J. M. Urban geographies in transition. A vision from Spain. Urban Science 5, 71 (2021).
Pareja-Eastaway, M. & Martinez, M. T. More social housing? A critical analysis of social housing provision in Spain. Critical Housing Analysis 4, 124–131 (2017).
Alberdi, B. Social housing in Spain. Social housing in. Europe 13, 223–237 (2014).
INE. INEbase/demography and population figures and demographic censuses /population and housing censuses/latest data. https://www.ine.es/dyngs/INEbase/en/operacion.htm?c=Estadistica_C&cid=1254736176992&menu=ultiDatos&idp=1254735572981 (2021).
Anselin, L. Local indicators of spatial association–LISA. Geographical analysis 27, 93–115 (1995).
Caragliu, A. & Del Bo, C. F. Smart cities and the urban digital divide. npj Urban Sustainability 3, 1–11 (2023).
Nijman, J. & Wei, Y. D. Urban inequalities in the 21st century economy. Applied Geography 117, 102188 (2020).
Musterd, S., Marcińczak, S., van Ham, M. & Tammaru, T. Socioeconomic segregation in European capital cities. Increasing separation between poor and rich. Urban Geog 38, 1062–1083 (2016).
Li, X. & Zhang, C. Did the COVID-19 pandemic crisis affect housing prices evenly in the U.S.? Sustainability 13, 12277 (2021).
Bashar, O. H. M. N. An intra-city analysis of house price convergence and spatial dependence. J. Real Estate Finance and Economics 63, 525–546 (2021).
Hu, J., Xiong, X., Cai, Y. & Yuan, F. The ripple effect and spatiotemporal dynamics of intra-urban housing prices at the submarket level in Shanghai, China. Sustainability 12, 5073 (2020).
Martínez-Toledano, C. House price cycles, wealth inequality and portfolio reshuffling. WID. World Working Paper, 2(8) (2020).
Raymond, E., Wang, K. & Immergluck, D. Race and uneven recovery: neighborhood home value trajectories in Atlanta before and after the housing crisis. Housing Studies 31, 324–339 (2016).
Christophers, B. A tale of two inequalities: housing-wealth inequality and tenure inequality. Environment and Planning A: Economy and Space 53, 573–594 (2021).
Cassiers, T. & Kesteloot, C. Socio-spatial inequalities and social cohesion in European cities. Urban Studies 49, 1909–1924 (2012).
Massey, D. S., Gross, A. B. & Eggers, M. L. Segregation, the concentration of poverty, and the life chances of individuals. Social Science Research 20, 397–420 (1991).
Musterd, S. Handbook of urban segregation. (2020).
Cadastral, C. Services INSPIRE of cadastral cartography. https://www.catastro.minhap.es/webinspire/index_eng.html (2016).
Lenzi, C. & Perucca, G. Economic inequalities and discontent in European cities. npj Urban Sustain 3, 1–9 (2023).
Díaz Orueta, F. Madrid: urban regeneration projects and social mobilization. Cities 24, 183–193 (2007).
Leal, J. Segregation and social change in Madrid metropolitan region. Greek Review of Social Research 113, 81–104 (2004).
Leal, J. & Sorando, D. Distant and Unequal: the Decline of Social Mixing in Barcelona and Madrid. Revista Española de Investigaciones Sociológicas 167, 125–148 (2019).
Lorenz, M. O. Methods of measuring the concentration of wealth. American Statistical Association 9, 209–219 (1905).
Gini, C. Measurement of Inequality of Incomes. Economic Journal 31, 124–125 (1921).
Giorgi, G. M. & Gigliarano, C. The Gini concentration index: a review of the inference literature. Journal Economic Surveys 31, 1130–1148 (2017).
Villar, J. G. & Raya, J. M. Use of a Gini index to examine housing price heterogeneity: a quantile approach. J. Housing Economics. 29, 59–71 (2015).
Rey, S. J. & Smith, R. J. A spatial decomposition of the Gini coefficient. Letters in Spatial and Resource Science 6, 55–70 (2013).
Fotheringham, A., & Rogerson, P. The Sage handbook of spatial analysis. SAGE (2009).
Crespo, R. & Hernandez, I. On the spatially explicit Gini coefficient: the case study of Chile–a high-income developing country. Letters in Spatial Resource Science 13, 37–47 (2020).
Panzera, D. & Postiglione, P. Measuring the spatial dimension of regional inequality: an approach based on the gini correlation measure. Social Indicators Research 148, 379–394 (2020).
Getis, A. A history of the concept of spatial autocorrelation: a geographer’s perspective. Geographical Analysis 40, 297–309 (2008).
Chhetri, P., Han, J. H. & Corcoran, J. Modelling spatial fragmentation of the brisbane housing market. Urban Policy Research 27, 73–89 (2009).
Moran, P. A. P. The interpretation of statistical maps. Journal Royal Statistical Society Series B Methodology 10, 243–251 (1948).
Wang, W.-C., Chang, Y.-J. & Wang, H.-C. An application of the spatial autocorrelation method on the change of real estate prices in Taitung City. ISPRS International Journal of Geo-Information 8, 249 (2019).
an de Meulen, P. & Mitze, T. Exploring the spatial variation in quality-adjusted rental prices and identifying hot spots in Berlin’s residential property market. Regional Studies, Regional Science 1, 310–328 (2014).
Dubin, R. A. Predicting house prices using multiple listings data. J. Real Estate Finance and Economics 17, 35–59 (1998).
Boeing, G. Online rental housing market representation and the digital reproduction of urban inequality. Environment and Planning. Economy Space 52, 449–468 (2020).
Su, S. et al. Do landscape amenities impact private housing rental prices? A hierarchical hedonic modeling approach based on semantic and sentimental analysis of online housing advertisements across five Chinese megacities. Urban Forestry & Urban Greening 58, 126968 (2021).
Han, L. & Strange, W. C. What is the role of the asking price for a house? J. Urban Economics. 93, 115–130 (2016).
Galesi, A., Mata, N., Rey, D., Schmitz, S., & Schuffels, J. Regional housing market conditions in Spain. Social Science Research Network (2020).
Bourassa, S. C., Cantoni, E., & Hoesli, M. “Spatial dependence, housing submarkets, and house prices.” Social Science Research Network (2005).
Bourassa, S. C., Hamelink, F., Hoesli, M. & MacGregor, B. D. Defining housing submarkets. Journal Housing Economics 8, 160–183 (1999).
Openshaw, S. Ecological fallacies and the analysis of areal census data. Environ. Plann. A 16, 17–31 (1984).
Openshaw, S. & Rao, L. Algorithms for reengineering 1991 census geography. Environ. Plann. A 27, 425–446 (1995).
Wong, D. W. S. “The Modifiable Areal Unit Problem (MAUP).” In WorldMinds: Geographical Perspectives on 100 Problems: Commemorating the 100th Anniversary of the Association of American Geographers, eds. Janelle, D. G., Warf, B., & Hansen, K., Springer Netherlands, Dordrecht, pp. 571–575 (2004).
Council, M. C. Distritos municipales de Madrid – Conjunto de datos. http://datos.gob.es/es/catalogo/l01280796-distritos-municipales-de-madrid (2021).
Council, M. C. Secciones censales – Conjunto de datos. http://datos.gob.es/es/catalogo/a13002908-secciones-censales1 (2019).
Council, M. C. Barrios municipales de Madrid – Conjunto de datos. http://datos.gob.es/es/catalogo/l01280796-barrios-municipales-de-madrid (2021).

Homeowners are leaving the high prices of the capital in favour of Britain’s Industrial Revolution cities, MailOnline can reveal.
Thousands of people are ditching London and instead looking to buy homes in cities such as Leicester, Glasgow, Sheffield and Bradford.
There were more than 75,000 searches for ‘homes for sale’ in Glasgow in the last 90 days – nearly double the interest in London, data from Purplebricks showed.
Second on the list was Sheffield with 61,000 searches, followed by 58,000 searches for properties in Bradford, once a hotbed of Britain’s textile trade.
Some 52,000 searches were made for the industrial giant of Leicester, and 43,000 for the Welsh port city of Swansea, less than 10 miles from towering steelworks in Port Talbot.
Manchester, Liverpool, London, Stoke on Trent and Birmingham all feature at the top of the table, receiving more than 30,000 searches since mid-December.
Housing expert David Hall told MailOnline: ‘Anywhere that has a developed infrastructure for transport is a model for somebody to look for cheaper prices.
‘In London [there are] eye-watering prices for properties.
‘You will see loads more of [people leaving London] in major towns and cities in the UK coming soon.
‘Don’t forget the interest rate rises for mortgages. Anyone who was looking to get a mortgage who thought for one minute they were going to get one for primetime in London has realised that’s not going to happen.
‘When you’re at 4.5 per cent, you have to move outside the city to be looking at something that’s affordable.’
Leaseholds expert Linz Darlington added: ‘There is a real appetite to move out of the capital.
‘While people love the hubbub of the city, London is incredibly expensive, particularly to buy a property in.
‘During the pandemic, people realised that London wasn’t the be-all and end-all.’
Here, MailOnline takes a look at some of the most popular places outside of London where house hunters are looking to buy properties…
Glasgow
The Industrial Revolution poured wealth and prosperity into Glasgow, turning a relatively small town into a giant of the British Empire.
Now over £5billion of new investment is set to transform the Clyde waterfront over the next 25 years.
This four-bed semi-detached home on Leithland Road in Pollok is available to buy for £185,000.
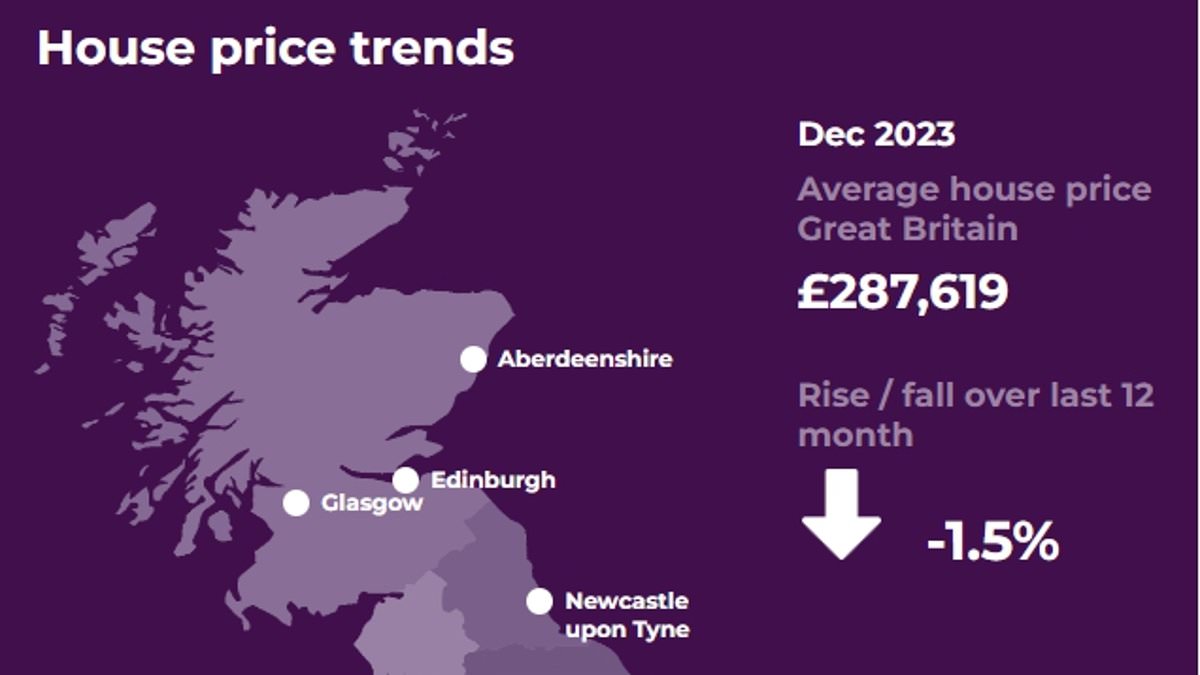
Homeowners in Glasgow have enjoyed a 4.3 per cent rise in property values, according to the latest House Price index – one per cent more than the 3.3 per cent increase seen across Scotland in the 12 months up to December.
Some see Glasgow properties as a great investment with average homes priced at £183,494, some £6,500 lower than the Scottish average and more than £150,000 cheaper than the average home in Edinburgh.
Sheffield
This three-bed home located in a desired cul-de-sac in Sheffield is on the market for £220,000.
While steel was once the main industry in Sheffield, South Yorkshire, the city is now seen as a superb employer in the tech and creative sectors.
Sheffield house prices bucked the national trend by increasing 4.9 per cent in the last 12 months, making the average property worth around £220,000.
It means they are around £82,000 cheaper than the average in England.
Sheffield’s central location in the UK means it is ideally located for travel and accessibility and has national and international connections.
Bradford
Nestled in a quaint neighbourhood, this charming two-bed terrace £180,000 house presents an enticing opportunity for families seeking a place to call home.
Bradford was once known as the wool capital of the world.
Worth £11.6billion, Bradford’s economy is now powered by advanced engineering, chemicals, automotive components and food manufacture alongside financial services and digital technologies.
The West Yorkshire city also bucked the national downward trend, with homeowners enjoying a 0.7 per cent annual increase, with the average property costing £173,337 – nearly half the national average.
Leicester
This £230,000 two-bedroom semi-detached house in Leicester, boasts three reception rooms.
Leicester’s industrial success took place in the 20th century, led by the success of its hosiery and footwear industries.
While manufacturing has been in decline across the UK in recent decades there are many modern industries thriving in and around Leicester, beyond its traditional textile trade.
The city boasts industries ranging from professional and financial services, advanced manufacturing and engineering to life sciences, space and digital technology.
Leicester has been ranked as the top city in the East Midlands to live and work as part of an influential nationwide industry report.
The average house price for the area is still below the national average at £232,324, but more expensive than nearby Birmingham at £228,877 and Nottingham at £192,298.
Swansea
This modern semi-detached two-bedroom house, located in the sought-after area of Sketty, is on the market for £190,000.
Swansea has a proud industrial heritage centred on coal, manufacturing and heavy industry.
Today, a large proportion of the economic growth is provided by public administration, education and health.
With the average price of a house at £196,000, Swansea is an affordable option for those looking to get on the property ladder, and nearly £20,000 cheaper than the Welsh average of £214,000.
Homeowners in the city saw a 0.8 per cent rise in the value of their properties in the last 12 months, despite a downturn of 2.5 per cent across Wales.
However, the port city is braced for a huge financial and social fallout after Tata confirmed plans to close two blast furnaces at nearby Port Talbot in January this year. The move is expected to cost of 2,800 jobs.
- Homes in London saw average of £53,000 wiped from values in last 12 months
- Nine London boroughs lose value – with Kensington and Chelsea worst hit
A new interactive map shows how London homeowners have seen property values tumble, with an average of £53,000 wiped off the value of their properties in the last 12 months.
Nine London boroughs were hammered by price plunges, with Kensington and Chelsea being the hardest hit area, shedding an eye-watering £154,000 in 12 months, according to House Price Index (HPI) data and analysis by online estate agent Purplebricks.
But it wasn’t all bad news for people living in and around the capital, with properties in the London borough of Richmond upon Thames increasing £22,730 in value, and homeowners in the Surrey district of Mole Valley seeing a rise of £46,089.
Other homeowners just outside the capital have little to celebrate too, with homes in nine commuter belt areas losing an average of £35,000 in the space of a year.
In total, 18 of the top 20 worst-hit areas were either in the capital itself or a borough or district surrounding it – the average loss among them being £53,000.
The stark figures from the Office for National Statistics reveal average UK house prices fell by £4,000 or 1.4% in the 12 months to December, making a typical house worth £285,000.
Search for YOUR local area in this widget from Purplebricks below, and find out how house prices have changed over the last 12 months.
Click here to resize this module
The fall in prices is a slight improvement on the drop of 2.3% for the 12 months up to November.
Average property prices in both England and Wales fell, with a typical house in England falling 2.1% in value to £302,000, and dropping 2.5% to £214,000 in Wales.
The North East of England saw the biggest price change with an increase of 1.2%, while overall London was hit the hardest with a 4.8% slump.
However, homes in Scotland are now worth an average of £190,000 after enjoying a 3.3% rise in the last year.
And, average properties rose 1.4% to £178,000 in Northern Ireland in the year to Quarter 4, from October to December 20223.
In the capital, the City of London and Westminster lost around £142,000 and £141,000 respectively, while Hammersmith and Fulham properties dropped £70,000, Waltham Forest homes lost £42,000 and Haringey shed £28,000.
Outside London, the leafy stockbroker belt town of Tunbridge Wells took a bruising, with the average home losing around £47,000.
Homes in popular commuter areas like Runnymeade, Surrey Heath, Welwyn Hatfield, Tonbridge and Malling and St Albans lost an average of £37,000 in the last 12 months.
Sam Mitchell, CEO of Purplebricks said: ‘While these figures may appear quite striking, there is plenty of good news for homeowners, and plenty more on the horizon.
‘Homeowners in Scotland and Northern Ireland are continuing to see increases, and evidently the rate of decline is slowing across the UK in general.
‘As long as we continue to see inflation moving in the right direction so the mortgage markets continue to move, I predict this trend will continue, and by the end of the year average UK prices will be back on the increase – and that, of course, includes the capital.’