

In roughly two years during the pandemic housing boom, home prices rose more than 40%. Since then, home prices continued their upward ascent. Capital Economics, for its part, recently said that the national average house price has risen almost 50% since the start of the pandemic. First American yesterday released its home price index report that found “house prices nationally are now 52% higher compared to pre-pandemic levels,” having increased more than 6% in the past year.
But maybe things are set to change. Zillow recently revised its home price forecast upward, but it only sees home values rising 1.9% this year; previously, it expected home prices to increase by 0.9%. Zillow called it “slower than long-term norms but a welcome slowdown for first-time buyers compared to the rapid appreciation seen over the pandemic,” in a report published earlier this week. Still, before the pandemic, it was normal for home prices to appreciate around either 5% or 6% each year, Redfin’s chief economist, Daryl Fairweather, recently noted.
It’s not the first time Zillow’s changed its home price forecast for the year, and probably won’t be the last. But its reasoning has to do with new for-sale listings and mortgage rates.
“With interest rates still elevated, the modest upward revision is mostly the result of a slowdown in the growth of new for-sale listings,” Zillow said. “After rising at an annual pace of 21% in February, the year-over-year increase in new listings eased in March to just 4%, indicating that the market remains quite tight for would-be homebuyers.”
Yesterday afternoon, Federal Reserve Chair Jerome Powell basically said interest rate cuts might not happen this year. “Right now, given the strength of the labor market and progress on inflation so far, it’s appropriate to allow restrictive policy further time to work,” he said, later adding that depending on inflation, the Fed will maintain the current interest rate levels for as long as needed.
That’s not good news for mortgage rates, or really anyone who wants to buy a home. In October last year, mortgage rates reached a more than two-decade high at 8.03%. For some time, they were falling, at one point dipping to 6.61%. But in the past week or so, mortgage rates have been on the rise; the latest reading showed the average 30-year fixed mortgage rate is 7.50%, the highest all year.
“Persistent inflation has diminished any optimism that the Federal Reserve may start to cut rates in June, meaning mortgage rates seem more and more likely to remain ‘higher for longer’ this year,” First American’s chief economist, Mark Fleming, said in an analysis accompanying its home price index.
No one knows what will happen with mortgage rates or new listings, but we know the lock-in effect is real: So as long as mortgage rates are higher than what people are used to, homeowners will choose not to sell. “Many sellers will remain on strike keeping a lid on supply,” Fleming said.
For its part, Zillow said, “It remains to be seen how new listings will fare in April—the Easter holiday falling in March and the fact that February was a leap year are likely clouding the broader picture.” Nevertheless, last year, existing home sales fell to their lowest point in almost 30 years; and Zillow seems to expect them to fall further this year.
“Zillow’s forecast now calls for 4.06 million existing home sales in 2024, slightly below both 2023’s level of 4.09 million and the previous forecast of 4.1 million existing home sales this year,” it said, despite February’s “better than expected sales.”
Subscribe to the CFO Daily newsletter to keep up with the trends, issues, and executives shaping corporate finance. Sign up for free.
-
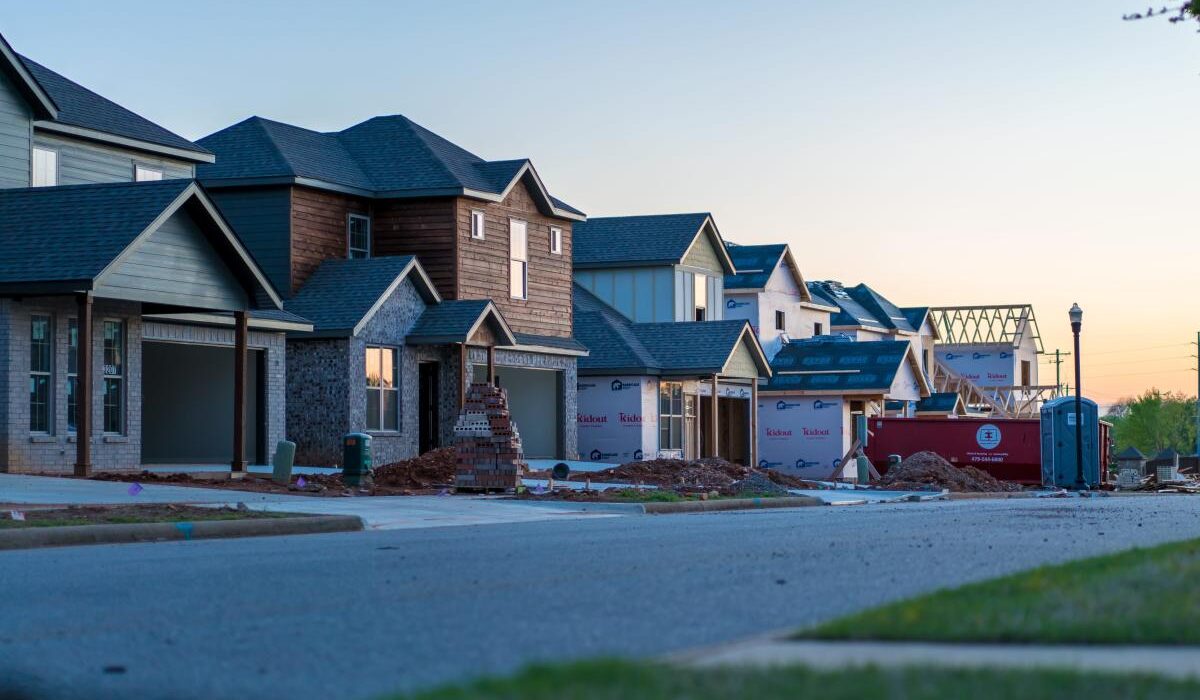
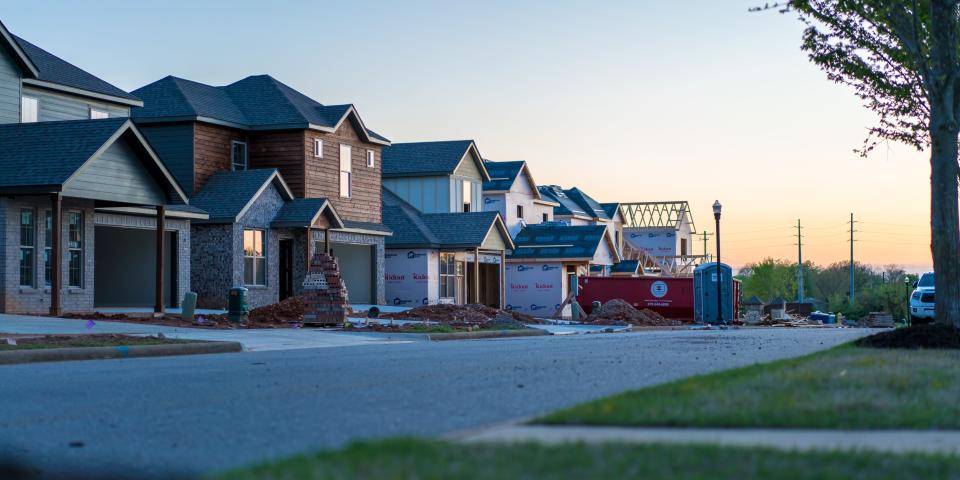
Zillow reported that a wave of new inventory hit the market in February.
-
New listings of existing homes on Zillow jumped 21% year-over-year last month.
-
The data suggest the “lock-in” effect and frozen housing market are softening.
High mortgage rates, elevated home prices, and tight inventory have kept many Americans sidelined from the housing market since the pandemic.
However, the “lock-in” effect — current owners being unwilling to move or refinance at higher rates — is showing signs of easing as more sellers begin to put their homes up for sale. Zillow data out Thursday showed new listings of existing homes jumped 20.8% in February compared to the same time in 2023, and climbed 20.3% month-over-month.
Not only that, but homeowner surveys suggest an increasing share of homeowners expect to sell in the next three years, which suggests some households may be done waiting for rates to drop before they wade back into the market.
Zillow reported that total inventory in February climbed 3.4% from January and that there were 12% more active listings last month compared to a year ago.
Inventories grew the most in Dallas (38.8%), Tampa (30.7%), and Orlando (29.5%), and rose in 33 of the largest 50 US markets.
On Thursday rates on the average 30-year fixed mortgage edged higher to to 7.02%.
Even if mortgage rates decline this year, strategists at Capital Economics aren’t anticipating a meaningful uptick in homebuying activity. In fact, they don’t foresee an end in sight for rising prices in the near term, forecasting a 5% jump in house prices in 2024, above the consensus 3%.
“Even if mortgage rates fall to 6% as we expect, mortgage rate ‘lock in’ will continue to curb home moves,” the strategists said. “As a result, we only anticipate a trickle of new resale supply coming onto the market over the next few years.”
Read the original article on Business Insider
Affiliate links for the products on this page are from partners that compensate us (see our advertiser disclosure with our list of partners for more details). However, our opinions are our own. See how we rate mortgages to write unbiased product reviews.
Mortgage rates initially ticked up a little bit following the release of Tuesday’s slightly hotter-than-expected Consumer Price Index data. But they’ve since trended back down and remain well below last month’s levels. Rates are still expected to go down this year.
Last month, average 30-year mortgage rates rose to 6.52%. So far this month, they’ve been trending a bit lower, and they could drop below 6% by the end of the year, according to Fannie Mae’s latest forecast.
But mortgage rates probably won’t drop substantially until we get more data showing that inflation is continuing to slow.
In February, prices rose 3.2% year over year, according to the Bureau of Labor Statistics. This is a slight uptick from the previous month, which showed prices rising 3.1% on an annual basis.
Federal Reserve officials want to see more data that inflation is coming down before they start lowering the federal funds rate. Once we get closer to a likely Fed cut, mortgage rates should start to fall.
Right now, investors still believe the Fed could start cutting rates as soon as June, according to the CME FedWatch Tool. So we could see mortgage rates go down in just a few months.
Mortgage Rates Today
| Mortgage type | Average rate today |
|
|
|
|
|
|
|
|
|
|
|
|
|
|
|
|
|
|
|
|
|
Mortgage Refinance Rates Today
| Mortgage type | Average rate today |
|
|
|
|
|
|
|
|
|
|
|
|
|
|
|
|
|
|
|
|
|
Mortgage Calculator
Use our free mortgage calculator to see how today’s mortgage rates will affect your monthly and long-term payments.
Mortgage Calculator
$1,161
Your estimated monthly payment
- Paying a 25% higher down payment would save you $8,916.08 on interest charges
- Lowering the interest rate by 1% would save you $51,562.03
- Paying an additional $500 each month would reduce the loan length by 146 months
By plugging in different term lengths and interest rates, you’ll see how your monthly payment could change.
Mortgage Rate Projection for 2024
Mortgage rates increased dramatically for most of 2023, though they started trending back down in the final months of the year. As the economy continues to normalize this year, rates should come down even further.
In the last 12 months, the Consumer Price Index rose by 3.2%, a significant slowdown compared to when it peaked at 9.1% in 2022. This is good news for mortgage rates — as inflation slows and the Federal Reserve is able to start cutting the federal funds rate, mortgage rates are expected to trend down as well.
For homeowners looking to leverage their home’s value to cover a big purchase — such as a home renovation — a home equity line of credit (HELOC) may be a good option while we wait for mortgage rates to ease. Check out some of the best HELOC lenders to start your search for the right loan for you.
A HELOC is a line of credit that lets you borrow against the equity in your home. It works similarly to a credit card in that you borrow what you need rather than getting the full amount you’re borrowing in a lump sum. It also lets you tap into the money you have in your home without replacing your entire mortgage, like you’d do with a cash-out refinance.
Current HELOC rates are relatively low compared to other loan options, including credit cards and personal loans.
When Will House Prices Come Down?
We aren’t likely to see home prices drop anytime soon thanks to extremely limited supply. In fact, they’ll likely rise this year as mortgage rates drop.
Fannie Mae researchers expect prices to increase 3.2% in 2024, while the Mortgage Bankers Association expects a 4.1% increase in 2024.
Lower mortgage rates will bring more buyers onto the market, putting upward pressure on prices. But prices aren’t currently expected to increase as much as they have in recent years.
Fixed-Rate vs. Adjustable-Rate Mortgage Pros and Cons
Fixed-rate mortgages lock in your rate for the entire life of your loan. Adjustable-rate mortgages lock in your rate for the first few years, then your rate goes up or down periodically.
So how do you choose between a fixed-rate vs. adjustable-rate mortgage?
ARMs typically start with lower rates than fixed-rate mortgages, but ARM rates can go up once your initial introductory period is over. If you plan on moving or refinancing before the rate adjusts, an ARM could be a good deal. But keep in mind that a change in circumstances could prevent you from doing these things, so it’s a good idea to think about whether your budget could handle a higher monthly payment.
Fixed-rate mortgage are a good choice for borrowers who want stability, since your monthly principal and interest payments won’t change throughout the life of the loan (though your mortgage payment could increase if your taxes or insurance go up).
But in exchange for this stability, you’ll take on a higher rate. This might seem like a bad deal right now, but if rates increase further down the road, you might be glad to have a rate locked in. And if rates trend down, you may be able to refinance to snag a lower rate
How Does an Adjustable-Rate Mortgage Work?
Adjustable-rate mortgages start with an introductory period where your rate will remain fixed for a certain period of time. Once that period is up, it will begin to adjust periodically — typically once per year or once every six months.
How much your rate will change depends on the index that the ARM uses and the margin set by the lender. Lenders choose the index that their ARMs use, and this rate can trend up or down depending on current market conditions.
The margin is the amount of interest a lender charges on top of the index. You should shop around with multiple lenders to see which one offers the lowest margin.
ARMs also come with limits on how much they can change and how high they can go. For example, an ARM might be limited to a 2% increase or decrease every time it adjusts, with a maximum rate of 8%.
-
Zillow released its 2024 Housing Market Prediction, and the results are surprising.
-
Buffalo, New York was deemed the hottest housing market of 2024, followed by Cincinnati and Columbus.
-
Zillow also predicts that home buying costs will level off and more properties will go on the market, but mortgage rates will remain very high.
The new year and fresh beginnings go together like Chip and Joanna Gaines. If you want to bring that “new year, new you” sentiment to your real-estate portfolio, Zillow thinks you should pack your bags and relocate to Buffalo, New York. The platform just released its list of 10 hottest housing markets for 2024, and the company sidestepped popular metropolises like New York, Los Angeles, and Chicago for smaller, less buzzy cities.
Admittedly, Buffalo seems like a rather surprising city to top the list; however, Zillow says the increased number of jobs created compared to the number of new homes construction projects being approved, will be what makes the Queen City in-demand.
“Buffalo has also seen slow and steady home value growth over the past few years. This market did not experience a pandemic boom and fizzle,” says Amanda Pendleton, Zillow’s home trends expert. “Instead, as home prices have rapidly risen elsewhere, Buffalo has become an affordable East Coast alternative for prospective home buyers looking to put down roots.”
Meanwhile, Cincinnati and Columbus ranked second and third, respectively, because they were two areas where the homes generally sold the fastest in 2023. Midsized cities like Providence, Indianapolis, and Cleveland will continue to be trending throughout 2024, while an interest in Tampa, Orlando, Atlanta, and Charlotte will make a case for moving to the south. Speaking of the south, Zillow also predicts homes around New Orleans, San Antonio, and Houston will be some of the hottest metro areas. (According to the real-estate platform, you can expect the average home value to drop by six percent.)
You might see home values drop in some parts of the country, but that’s not a nationwide trend. In fact, Zillow’s 2024 Housing Market Predictions anticipates that while home buying costs will level off—and more properties will go on the market—mortgage rates will remain very, very high. And that’s what brings us to Zillow’s most interesting finding: Some people are giving up on buying a starter home altogether. As many households continue to be priced out of starter homes, you can expect single-family residences to become all the rage. “In 2024, those renter households may have more options when looking for a larger, single-family rental,” Pendleton adds.
Of course, Pendleton points out that prospective homebuyers renters aren’t the only ones who will reap the rewards this year. “A recent survey from Zillow Home Loans finds one in five homeowners say they are considering renting out their home instead of selling it,” she says.”Those who locked in an ultra-low mortgage rate during the pandemic may decide it makes more financial sense for them to rent than sell in today’s market, which could help add single-family rental inventory.”
But regardless of where you live—and whether you buy or rent—one thing’s for sure: A surge of optionality will give you plenty of ways to score your dream home.
You Might Also Like

Real estate apps have been around for over 10 years now — and it seems like new ones come out as regularly as homes come to market. As their numbers grow, so does their variety: In addition to applications for buying, selling, and renting real estate, there are now platforms for obtaining mortgages, investing in real estate, and even designing a house.
Here are the nine of the best real estate applications on the market today.
What are real estate apps?
Real estate apps (short for applications) are a one-stop shop for prospective tenants, home buyers, home sellers, home owners and investors — not to mention the folks who like to just browse. They consist of databases with thousands — sometimes even millions — of properties, like a vast, location-spanning multiple listings service (MLS).
Most of these mobile apps make their money by charging a listing fee, selling ad space to Realtors or contractors, or taking a cut of the sale price or rent. Some are backed by real estate companies or brokerages, like Zillow and Redfin. Others are independent.
Types of real estate apps
The majority of real estate applications are focused on the house-hunting and renting experience. They’re a place for buyers to browse homes for sale or rent and a place for sellers and landlords to do market research, and list their properties for sale or rent.
There are real estate apps that focus on commercial properties to buy, sell or lease. Some provide directories of real estate agents and brokerages; others are oriented towards lenders and financial services. Rising in popularity of late have been apps geared real estate investments and home design.
Zillow
Best for initial research for home buying, renting, or selling
One of the most well-known and highly rated real estate search apps, the free Zillow app gives users access to a wide range of properties with detailed filter criteria. Through the app, you can coordinate your search for a home with someone else, meaning you or your roommate or partner can share your favorite finds easily.
The Zillow app does have a few flaws, however. Zillow’s “Zestimate,” its home evaluation tool, doesn’t always give an accurate picture of a home’s value, especially when details are missing from a listing. Real estate agents can also pay to have themselves featured as a contact for a property, even if they aren’t the actual listing agent, which can confuse things for homebuyers.
Pros:
- Most widely used application
- Can find homes for sale or for rent
- Can view sale price history for the whole neighborhood
Cons:
- Sometimes flawe price estimates and rental estimates
- Your information may be sold to lenders and Realtors
- Asking questions can lead to wave of unsolicited emails
Redfin
Best for saving on commissions
If you’re seriously home-hunting, the Redfin app can be a useful tool. Redfin is a real estate brokerage, so in addition to searching for properties through the app, you can go ahead and buy one with a Redfin agent and receive a portion of the agent’s commission back. If you sell your home and buy another one with a Redfin agent, you’ll only pay a 1% listing fee for your home, saving you from the standard 3% on both transactions.
The Redfin app also offers home value estimates, which might be more accurate than Zestimates, but still aren’t a substitute for an appraisal. Overall, the app is highly rated by users, and it’s free, making it a solid option for house hunters.
Pros:
- Save thousands in commission when buying or selling
- Accurate home value estimates
Cons:
- Limited neighborhood info
- Rental side is new with limited listings
Trulia
Best for getting a feel for a neighborhood
Trulia is actually owned by Zillow and uses information that comes from Zillow, but augments it a bit. Trulia includes features like drone film footage, quotes from people who live in the area, school ratings and walkability scores. Trulia’s home value estimates may be more accurate than Zillow’s because it uses more data points.
Pros:
- Extensive neighborhood data available in the app
- More accurate home estimates
- Easy to identify and contact the listing agent
Cons:
- Not great for home sellers: no agent directory, neighborhood price history isn’t as thorough
- Application can be difficult to navigate
Apartments.com
Best for renters
Are you looking for a rental? The Apartments.com app can help you easily unearth your next place. The app offers a streamlined search experience for apartments, condos, homes and townhomes, and you can sort through rentals based on unique filters such as wheelchair access, in-unit laundry, pet-friendliness or the addition of a dishwasher.
Although it’s free to browse rentals through the app, you’ll run into a fee if you want to apply for one directly through the platform. The in-app rental application costs $29.00 plus tax for up to 10 applications made within a 30-day period.
Pros:
- Apply to many apartments for the same fee
- View many types of rentals in one spot
Cons:
- Limited adoption outside of metropolitan areas
- No reviews from current or former tenants
Realtor.com
Best for landlords and for most accurate data
Homebuyers and renters alike can gain access to the most (and most up-to-date) listings by using the free Realtor.com app. With an extremely wide selection of properties available, you’re able to see all of the options out there. Realtor.com is also affiliated with the National Association of Realtors (NAR) and has access to a large portion of multiple listing services, so its listings are usually refreshed quicker compared to other sites.
Realtor is the only application on our list that lets landlords list rentals and take applications for free. So it might benefit you if you’re thinking about leasing that garage apartment or guest house or a second home.
In addition, listings on the Realtor.com app include handy information and filters, like the noise level of a neighborhood or commute time, which can be helpful when looking for a place to call home.
Pros:
- Updates the quickest: best spot to find brand new listings and see when something is sold
- Commute and noise level data in app
- Free rental listing and applications
Cons:
- Can’t filter results as thoroughly as other apps
- No easy way to see neighborhood home values
LoopNet
Best for commercial real estate
Residential real estate isn’t the only game in town. If you’re looking for a commercial property, the LoopNet app can help you find the perfect fit, and more information than what would be available on other apps geared toward residential homebuyers. You can easily search based on the type of commercial property you’re looking for, including office, retail, restaurant or multifamily dwelling.
One drawback that seems to be an issue among users, however, is the inability to save your search within the app. That means you’ll be forced to re-enter your search filters every time you want to explore listings.
Pros:
- Easy to find commercial properties for rent and for sale
- Thorough details in property listings
Cons:
- Only lists properties, not businesses that are for sale
- Limited tools like rent forecasts and loan calculators
Landa
Best for beginning real estate investors
The Landa app allows users to invest in real estate with as little as $5. Users can view rentals available to invest in and buy shares in properties. The application has an interface that allows you to see your real estate portfolio all in one place and updates you when you receive your share of the rental income.
Pros:
- Easy to find investment properties
- Low financial cost to get started
Cons:
- Limited real estate investment education within the application
- Newer company, limited track record
Rocket Mortgage
Best for financing
Rocket Mortgage is one of the top home loan lenders in the country. They have developed an industry-leading application that allows you to do most of the process on your phone. You can get pre-approval for a mortgage, submit documentation for underwriting, and e-sign your documents all in the secured application.
Pros:
- Streamlines the lending process: You can prequalify, submit documents and sign them all in the application
- Can submit mortgage payments on the app
- Includes affordability and payment calculators
Cons:
- Limited in-app financial education
Houzz
Best for people designing and building homes
Houzz is ideal for anyone designing their own home. The app allows you to decide layouts, color palettes and more. It can connect you with contractors, designers and builders all in one place. It even has a shopping cart where you can pick out furnishings and lighting fixtures, and have them shipped directly to your build site.
Pros:
- Connects you with local construction professionals
- Presents digital mock-ups of how things will look in your home
- Offers high-quality furnishings
Cons:
- High prices for most goods and services
- Potentially limited list of contractors
FAQs
-
One prized feature of home buying-oriented apps is the property evaluations they set on listings. They determine home value through proprietary algorithms. These algorithms incorporate data that includes things like recent home sales in the area, age of the home, square footage of the home, number of rooms and any previous sale price of the home — all factors that professional human appraisers often use, too.
-
Real estate applications have varying accuracies. The tools used by Trulia, Realtor and Redfin are generally viewed as the most accurate. Zillow’s estimate has become a bit of a joke in the industry.
Also, the apps don’t have a way to know everything that can significantly affect your home’s value — like its curb appeal or its condition. For example, they can’t know if you recently updated the kitchen, or that the carpeted floors are redolent of years of smoking and cats. All of these things can make the sum your home commands on the market quite different by than the estimate their computer came up with.