
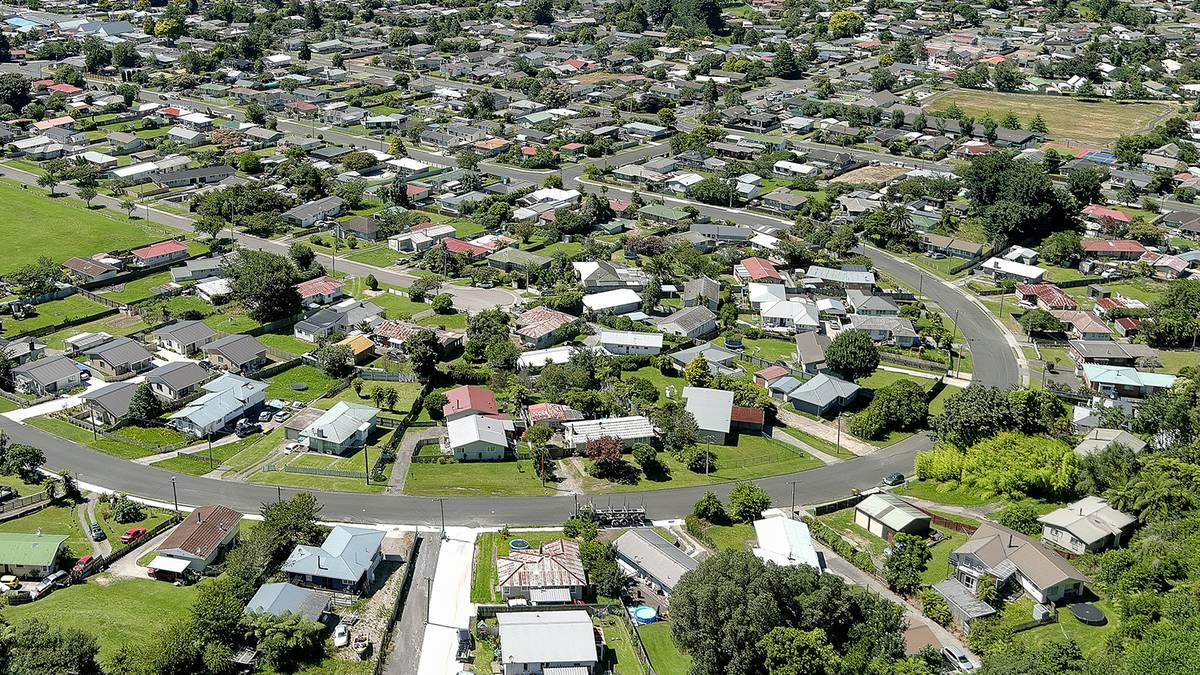
The average price of a house in Rotorua has risen to $746,000 after the city’s average residential property values increased by 0.4 per cent in three months.
According to the latest data from the OneRoof Valocity House Value Index, taken at the end of January, property values across the country are up by 0.9 per cent compared to three months ago.
OneRoof’s latest House Price Report showed property values were up quarter-on-quarter in 90 per cent of suburbs nationwide, with the biggest quarterly lifts in Arrowtown, Mataura and Whitford.
Of the 793 suburbs with 20-plus settled sales in the last 12 months, more than 40 per cent saw year-on-year value lifts, reflecting the turnaround in the market.
AdvertisementAdvertise with NZME.
Rotorua suburbs with more than 20 settled sales in the year ending January 31 included Hamurana, where property values increased by 2.1 per cent in the last three months to $1.23 million.
Western Heights saw the second-highest three-month increase in suburb property value, a difference of 2 per cent.
Rotorua Professionals McDowell Real Estate principal and auctioneer Steve Lovegrove said the post-summer, early autumn season was normally a busy one for real estate.
“The good news for everybody is that prices seem to be mostly stable, certainly not going backwards and probably increasing,” Lovegrove told the Rotorua Daily Post.
AdvertisementAdvertise with NZME.
“We are starting to see the green shoots of property price increases.”
Lovegrove said there was also a lift in the stock available.
“So buyers do have a little more choice and less need to act urgently. We’re seeing a little bit of lag in decision-making and a significant lift in buyers actively entering the marketplace.”
Lovegrove said there was more competition for properties in the $500,000 to $700,000 value range.
“Anything just below that average price is getting hit quite hard with active buyers, mostly first-home buyers.”
Lovegrove said there was also a trend of people looking to downsize which also saw more buyers looking in the lower price ranges.
“There’s a lot of confidence, a positive vibe and a positive outlook looking forward. We’re not expecting a rapid price increase. We are expecting simply more confidence.”

Tremains central region general manager Stuart Christensen said there was more property coming onto the market.
“More people have decided to make a move. Westpac dropped their interest rates on Friday. All those are encouraging signs,” Christensen said.
“We are seeing an increasing number of people at our open homes. So there’s appetite to come out and a good number of first-home buyers are out there.”
AdvertisementAdvertise with NZME.
Christensen said first-home buyers did have a window to make their decisions, however, as investors were coming gradually back into the market as well.
“Overall there’s a lot more positivity. It’s a new year. People are out looking for a move whether they are upsizing, downsizing or entering the market for the first time.”

The news comes after New Zealand’s average property value grew just 0.9 per cent in the three months to the end of November to $973,000, as buyers retreated from the market after a busy November and October.
Valocity global chief executive of real estate Helen O’Sullivan said sales volumes in December were lower than had been anticipated, given the lift in October and November, although they were up year-on-year.
Valocity data showed mortgages registered to first-home buyers in the last quarter of the year dipped to 44 per cent from the five-year high of 45 per cent the previous quarter. Mortgages registered to investors increased slightly from 22.4 per cent to 23.6 per cent over the same period.
O’Sullivan said the Reserve Bank’s announcement around debt-to-income ratios was unlikely to have an impact on the current market.
AdvertisementAdvertise with NZME.
“The proposed settings are not expected to make a significant difference to prices or activity levels in the current high-interest rate environment,” she said.
“When interest rates are lower, [debt-to-income ratios] will limit the level of debt borrowers can assume despite being able to service the debt.”
Maryana Garcia is a regional reporter writing for the Rotorua Daily Post and the Bay of Plenty Times. She covers local issues, health and crime.
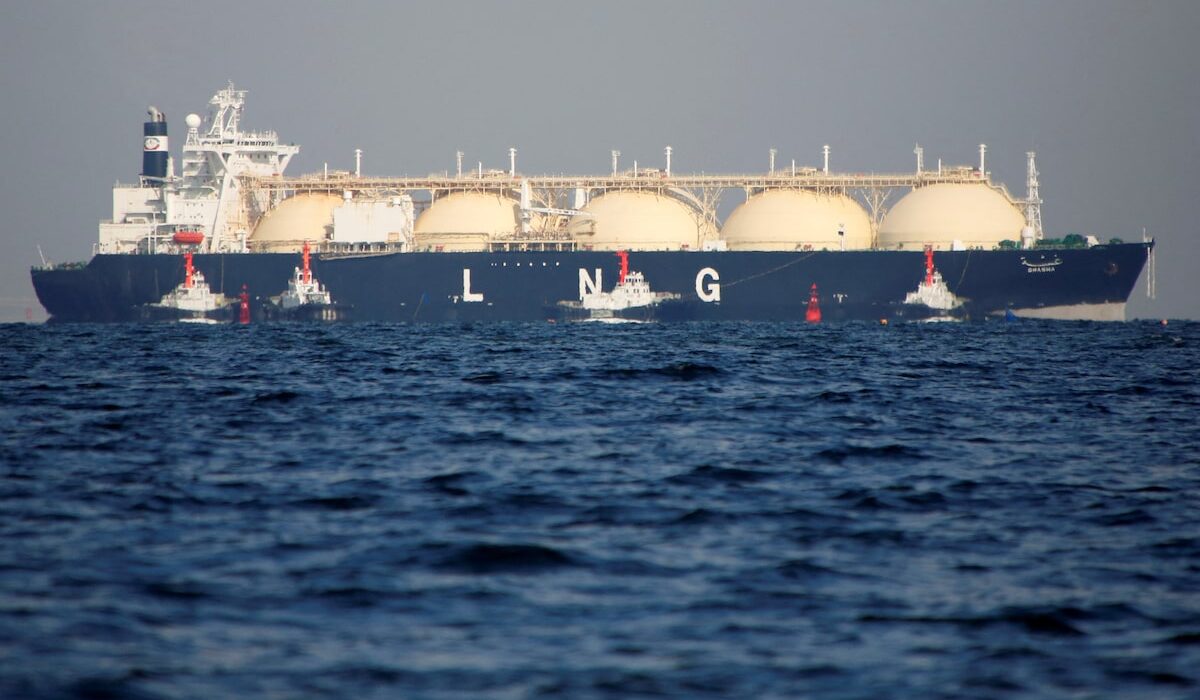
Global prices of gas and liquefied natural gas (LNG) are expected to remain relatively weak in 2024, with demand subdued due to high storage levels in Europe and Asia and a mild Northern Hemisphere winter, consultancy Wood Mackenzie said on Wednesday.
“Wood Mackenzie has been forecasting lower 2024 prices for much of last year, especially compared to forward curves, amid weak market fundamental expectations,” Massimo Di Odoardo, Vice President of Gas Research at Wood Mackenzie, said.
“Global LNG supply growth will remain limited at 14 million tonnes (Mt), but with Asian LNG demand still weak, competition for LNG is unlikely to heat up,” he added.
LNG prices dropped 58 per cent in 2023 to levels slightly below $12 per million British thermal units (mmBtu) and fell further in the first two weeks of January to $10.025 on Wednesday, their lowest level since June 2023.
In Europe, gas prices have fallen 45 per cent to $10/mmBtu in the past three months, the report said, expecting market sentiment for gas and LNG to remain bearish into 2024.
Gas demand in Europe fell by 7 per cent in 2023 as mild weather reduced consumption, the report said.
“Normal weather dynamics and a possible economic rebound would support demand, however with renewable supply increasing by more than 100 terra watt hours and nuclear production in France continuing to come back, European gas demand will remain flat at best.”
In Asia, demand this year is expected to grow by 12.5 million metric tons, or 5 per cent from 2023, but remains 3 million tons lower than its 2021 levels.
On LNG contracting, Di Odoardo said overall activity is expected to soften in 2024 compared to a huge numbers of deals signed in 2021 to 2023.
Key LNG portfolio players are expected to be more selective this year, after signing 72 million tons per annum (mmtpa) in contracts in 2022 and 2023, the report said.
“However, some buyers might take a more opportunistic approach, with U.S. independent players leveraging on low Henry Hub prices to seek more exposure to global LNG prices by taking long-term LNG capacity positions, or more activity emerging in price sensitive Asian markets if contract prices fall further,” the report said.
The United States supplies buyers in both Europe and Asia, but is increasingly focused on Europe, especially with the loss of much of the continent’s supply of Russian pipeline gas following Moscow’s invasion of Ukraine two years ago.