

Home prices aren’t showing any sign of slowing down—yet.
Prices in February in 20 of the nation’s large metros are expected to have risen at a relatively quick clip—though some cities likely saw stronger gains than others.
The S&P CoreLogic Case-Shiller Home Price index tracking changes in 20 major cities, which is set to be published on Tuesday, is estimated to have climbed 6.6% in February from the year prior, according to FactSet, tied with January’s reading. On a seasonally adjusted basis, prices are expected to have gained 0.15% month-over-month.
The data lags other releases, but is closely watched for its comprehensive methodology, which is designed to minimize the impact of home size and type, is based on a three-month moving average, and is released as both seasonally adjusted and unadjusted data sets. The data is published at a national level, as well as in indexes tracking performance in some of the nation’s largest cities.
To get a sense of how the 20 metros may have fared in February, Barron’s looked at
data capturing February’s metro-level median sale price. According to Zillow’s data, the 20 cities included in the Case-Shiller index increased an average 6.8% in February from the year prior.
Advertisement – Scroll to Continue
Gains measured by Zillow in February were strongest in Boston, New York, and Miami, where year-over-year price gains ranged from about 10% to 12%. Among the 20 cities, Denver, Minneapolis, and Portland, Ore., were the weakest. Prices in these metros rose between 1.5% and 3.4% from the year prior. To be sure, the Zillow data only reflects one month and includes both condos and single-family units.
Home price growth could slow in March. A Moody’s Analytics index tracking home price appreciation rose 5.9% in March, slower than the 6.1% annual gain in February. “While affordability is near a four-decade low, a limited supply of homes for sale is keeping a floor under prices,” wrote Moody’s Analytics housing economist Matthew Walsh, adding that he expects more homes to hit the market as mortgage rates fall slightly and more sellers choose to list.
It will take time for April’s home price trends to become clear—but early data suggests that quickly rising mortgage rates have had little impact on prices so far. The median home in the four weeks ended April 21 sold for $384,000, according to Redfin—up roughly 5% from a similar period one year prior.
Advertisement – Scroll to Continue
Stretched home affordability will catch up with prices, says Walsh—eventually. “Moody’s Analytics expects real price declines given the imbalance between median house prices and median incomes, but this adjustment process will occur over an extended time, barring a recession,“ he wrote.
Write to Shaina Mishkin at shaina.mishkin@dowjones.com
by Calculated Risk on 4/27/2024 08:11:00 AM
The key report scheduled for this week is the April employment report.
Other key reports include February Case-Shiller house prices, April vehicle sales, and the March trade balance.
The FOMC meets this week and no change to policy is expected.
For manufacturing, the April Dallas Fed manufacturing survey, and the ISM index will be released.
—– Monday, April 29th —–
10:30 AM: Dallas Fed Survey of Manufacturing Activity for April.
—– Tuesday, April 30th —–
 9:00 AM: S&P/Case-Shiller House Price Index for February.
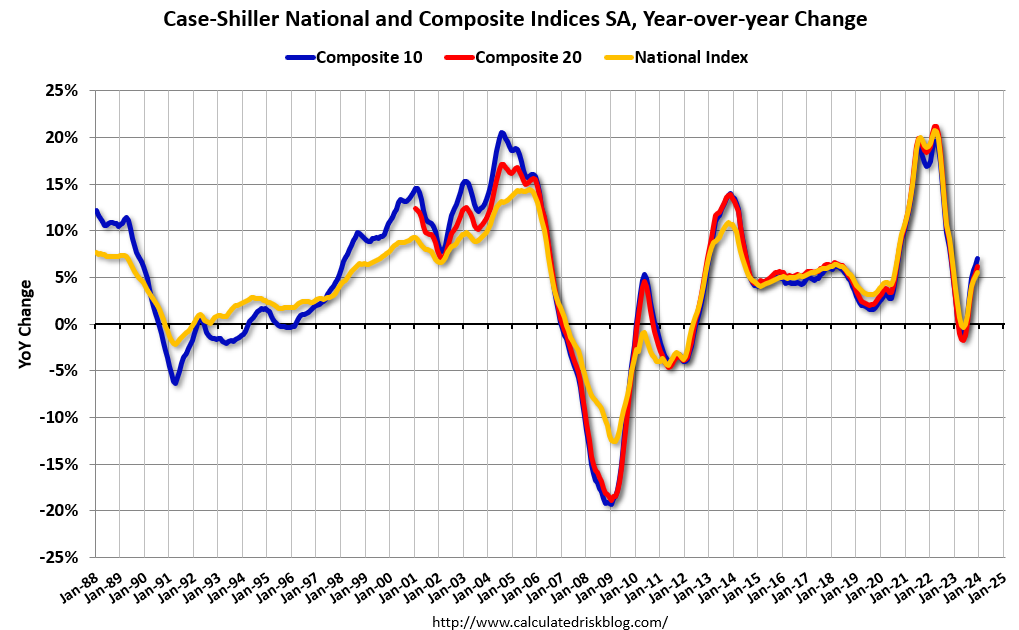
This graph shows the nominal seasonally adjusted National Index, Composite 10 and Composite 20 indexes through the most recent report (the Composite 20 was started in January 2000).
The consensus is for a 6.7% year-over-year increase in the Comp 20 index for February.
9:00 AM: FHFA House Price Index for February. This was originally a GSE only repeat sales, however there is also an expanded index.
9:45 AM: Chicago Purchasing Managers Index for April. The consensus is for a reading of 45.0, up from 41.4 in March.
10:00 AM: the Q1 2024 Housing Vacancies and Homeownership from the Census Bureau.
—– Wednesday, May 1st —–
7:00 AM ET: The Mortgage Bankers Association (MBA) will release the results for the mortgage purchase applications index.
8:15 AM: The ADP Employment Report for April. This report is for private payrolls only (no government). The consensus is for 180,000 payroll jobs added in April, down from 184,000 added in March.
10:00 AM ET: ISM Manufacturing Index for April. The consensus is for the ISM to be at 50.1, down from 50.3 in March.
10:00 AM: Construction Spending for March. The consensus is for a 0.3% increase in construction spending.
 10:00 AM ET: Job Openings and Labor Turnover Survey for March from the BLS.
This graph shows job openings (black line), hires (dark blue), Layoff, Discharges and other (red column), and Quits (light blue column) from the JOLTS.
Jobs openings were little changed in February at 8.76 million from 8.75 million in January.
The number of job openings (black) were down 11% year-over-year in February.
2:00 PM: FOMC Meeting Announcement. No change to policy is expected at this meeting.
2:30 PM: Fed Chair Jerome Powell holds a press briefing following the FOMC announcement.
 All day: Light vehicle sales for April. The expectation is for light vehicle sales to be 15.7 million SAAR in April, up from 15.5 million in March (Seasonally Adjusted Annual Rate).
This graph shows light vehicle sales since the BEA started keeping data in 1967. The dashed line is the sales rate for the previous month.
—– Thursday, May 2nd —–
8:30 AM: The initial weekly unemployment claims report will be released. The consensus is for 210 thousand initial claims, up from 207 thousand last week.
 8:30 AM: Trade Balance report for March from the Census Bureau.
This graph shows the U.S. trade deficit, with and without petroleum, through the most recent report. The blue line is the total deficit, and the black line is the petroleum deficit, and the red line is the trade deficit ex-petroleum products.
The consensus is the trade deficit to be $68.8 billion. The U.S. trade deficit was at $68.9 billion in February.
—– Friday, May 3rd —–
 8:30 AM: Employment Report for April. The consensus is for 210,000 jobs added, and for the unemployment rate to be unchanged at 3.8%.
There were 303,000 jobs added in March, and the unemployment rate was at 3.8%.
This graph shows the jobs added per month since January 2021.
10:00 AM: the ISM Services Index for April. The consensus is for a reading of 52.0, up from 51.4.

Data is delayed by 20 minutes
Data is delayed by 20 minutes
To see more commodities please register for our portal
Traders have long-abandoned hopes for a first US rate cut in May, and next week’s bumper release of labour market data could sway the case for a June pivot. In the March meeting, US rate-setters warned that “job gains have remained strong and the unemployment rate has remained low”. Policymakers will be paying close attention to next week’s JOLTs job openings, ADP employment survey and payroll data.
More UK house price data will be released on Friday, courtesy of the Halifax House Price Index. Last month’s data showed that February prices were 1.7 per cent higher than in the same month a year earlier – mirroring the trend seen in other house price indices this year. Kim Kinnaird, director of Halifax Mortgages, said that the statistics “align with other promising signs of increased housing activity, such as mortgage approvals”, and leave average house prices only £1,800 off their June 2022 peak.
Monday 1 April
China: Final manufacturing PMI
Japan: Large Manufacturing Index, final manufacturing PMI
US: Manufacturing PMI, ISM manufacturing, construction spending
Tuesday 2 April
Euro area: Final manufacturing PMI
UK: BRC shop price index, final CIPS manufacturing PMI, mortgage approvals, M4 money supply, net consumer credit
US: Auto sales, factory inventories, JOLTS job openings
Wednesday 3 April
Euro area: Inflation, core inflation, unemployment rate
China: Services PMI
Japan: Services PMI
US: ADP employment survey, final composite and services PMIs, ISM services
Thursday 4 April
Euro area: Final composite and services PMIs, PPI inflation
Japan: Foreign bond investment
UK: Final CIPS composite and services PMIs
US: Trade balance
Friday 5 April
Euro area: Retail sales
Japan: Real household consumption, real household income, FX reserves, preliminary Leading Index figures
UK: Halifax HPI, CIPS construction PMI
US: Hourly earnings, average workweek, manufacturing payrolls, non farm payrolls, unemployment rates, consumer credit
by Calculated Risk on 3/27/2024 09:41:00 AM
Today, in the Calculated Risk Real Estate Newsletter: Inflation Adjusted House Prices 2.4% Below Peak
Excerpt:
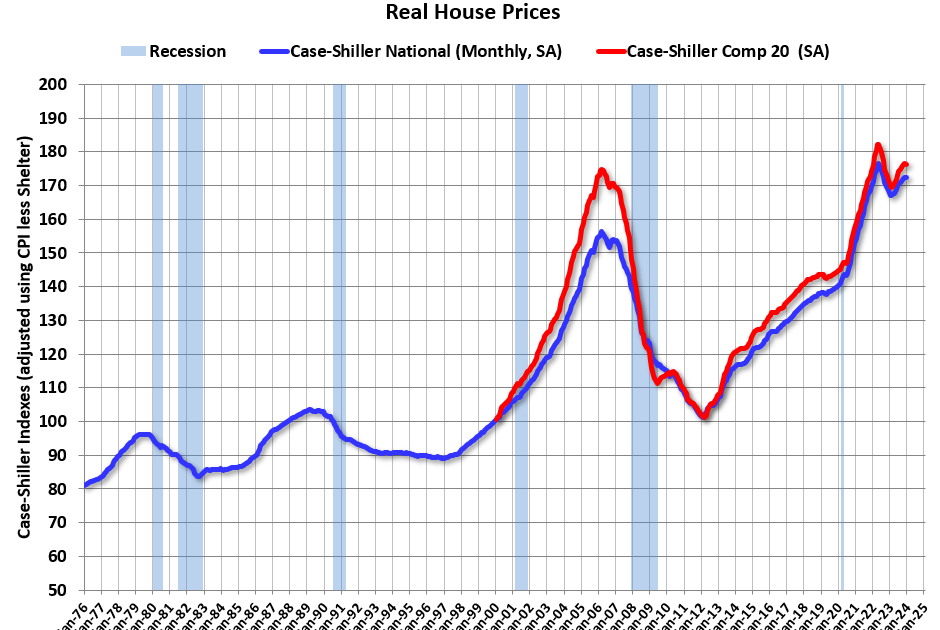
It has been over 17 years since the bubble peak. In the January Case-Shiller house price index released yesterday, the seasonally adjusted National Index (SA), was reported as being 71% above the bubble peak in 2006. However, in real terms, the National index (SA) is about 10% above the bubble peak (and historically there has been an upward slope to real house prices). The composite 20, in real terms, is 1% above the bubble peak.
People usually graph nominal house prices, but it is also important to look at prices in real terms. As an example, if a house price was $300,000 in January 2010, the price would be $427,000 today adjusted for inflation (42% increase). That is why the second graph below is important – this shows “real” prices.
The third graph shows the price-to-rent ratio, and the fourth graph is the affordability index. The last graph shows the 5-year real return based on the Case-Shiller National Index
…The second graph shows the same two indexes in real terms (adjusted for inflation using CPI).
In real terms (using CPI), the National index is 2.4% below the recent peak, and the Composite 20 index is 3.3% below the recent peak in 2022. Both indexes were mostly flat in January in real terms.
In real terms, national house prices are 10.2% above the bubble peak levels. There is an upward slope to real house prices, and it has been over 17 years since the previous peak, but real prices are historically high.

There is much more in the article.
by Calculated Risk on 3/26/2024 01:00:00 PM
Two key points:
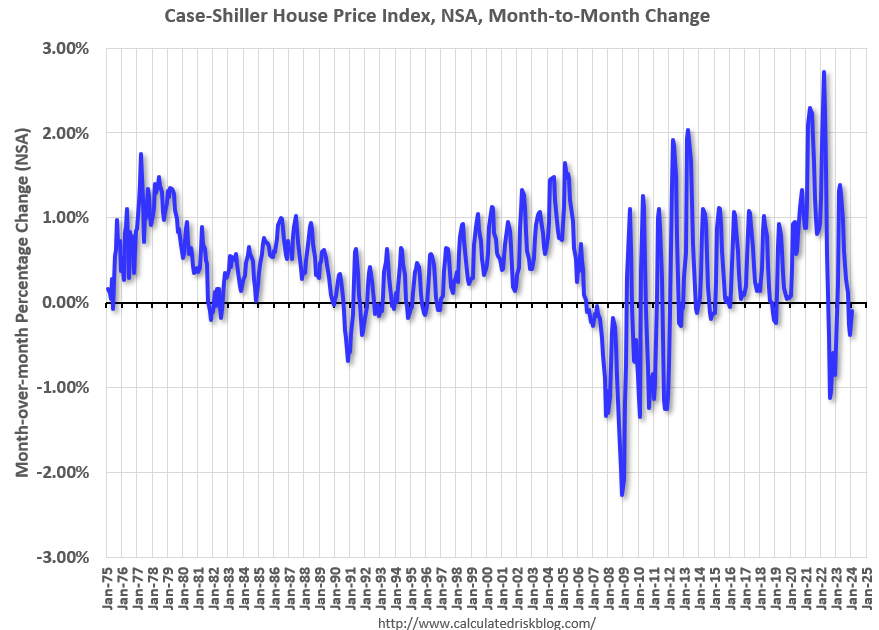
1) There is a clear seasonal pattern for house prices.
2) The surge in distressed sales during the housing bust distorted the seasonal pattern. This was because distressed sales (at lower price points) happened at a steady rate all year, while regular sales followed the normal seasonal pattern. This made for larger swings in the seasonal factor during the housing bust.

Click on graph for larger image.
This graph shows the month-to-month change in the NSA Case-Shiller National index since 1987 (through January 2024). The seasonal pattern was smaller back in the ’90s and early ’00s and increased once the bubble burst.
The seasonal swings declined following the bust, however the pandemic price surge changed the month-over-month pattern.
 The second graph shows the seasonal factors for the Case-Shiller National index since 1987. The factors started to change near the peak of the bubble, and really increased during the bust since normal sales followed the regular seasonal pattern – and distressed sales happened all year.
The swings in the seasonal factors were decreasing following the bust but have increased again recently – this time without a surge in distressed sales.
Using the 2018 and 2019 seasonal factors, the Seasonally Adjusted Case-Shiller index would have declined slightly in January instead of increasing 0.4% month-over-month.

Home prices increased at the fastest clip since 2022 at the start of the year, according to one closely watched home price gauge published Tuesday.
Home prices nationally in January were 6% higher than the same month in 2023, according to S&P CoreLogic Case-Shiller data. Prices in an index measuring changes in 20 of the nation’s large cities increased 6.6%.
Both indexes increased at the quickest annual pace since November 2022.
Seasonally adjusted prices also gained, with the 20-city index rising 0.14% from December, and the national index gaining 0.36%.
“U.S. home prices continued their drive higher,” Brian D. Luke, head of commodities, real and digital assets at S&P Dow Jones Indices, said in a statement. “On a seasonal adjusted basis, home prices have continued to break through previous all-time highs set last year.”
Advertisement – Scroll to Continue
The quick annual gain was expected. The 6.6% gain in the 20-city index was in line with the consensus call among economists surveyed by FactSet. Price gains will continue, but will slow by the end of the year, some economists say.
Prices were higher than year-ago levels in each of the 20 cities tracked by the index. Prices in San Diego, Los Angeles, and Detroit were highest compared to one year prior, rising 11.2%, 8.6%, and 8.2% respectively. The cities with the slowest gains included Dallas, Denver, and Portland, Ore., where prices grew 2.9%, 2.7%, and 0.9%, respectively.
A low supply of homes for sale, combined with a relatively easy comparison with prices at the same time last year, look set to keep prices strong this spring.
Advertisement – Scroll to Continue
The median home in February sold for $384,500, up 5.7% from the same month in 2023, according to the National Association of Realtors. It was the greatest price increase in the trade group’s data set since October 2022.
data suggest prices have remained strong in March. Over the four-week period ended March 17, home-sale prices rose 5.3%.
Industry economists expect gains will slow later this year. The Mortgage Bankers Association estimates that home prices in the fourth quarter measured by the Federal Housing Finance Agency’s home price index will be 4.1% higher than one year prior—a slower growth rate than the anticipated 5.7% in the first quarter of this year.
expects its home price index to be 3.2% higher than one year prior at the end of the year, slower than an anticipated 7.2% first-quarter increase.
Advertisement – Scroll to Continue
That’s despite mortgage rates that remain higher than levels immediately before the pandemic. Higher rates and prices has made it harder for first-time buyers to enter the market. The share of buyers purchasing a previously owned home for the first time fell to 26% of all transactions in February from 28% the month prior, the National Association of Realtors said earlier this month.
The typical buyer in February needed an annual income of $113,520 to afford the median U.S. home, according to a Redfin analysis published Tuesday. That is nearly $30,000 more than the median household income, the brokerage said. The last time the typical household earned more than it needed to afford the median home was three years ago, in February 2021, according to the analysis.
Home values are stretched relative to their historic price-to-rent ratio, Mark Zandi, Moody’s Analytics’ chief economist, wrote in a Monday note. “That valuations have remained so high given the doubling in mortgage rates since just prior to the pandemic is especially surprising,” the economist wrote, adding that high home prices are supported by an undersupply of housing and the mortgage rate lock-in effect.
“For some semblance of normalcy to return to the housing market, something has to give—mortgage rates need to decline, incomes rise, and/or house prices cool considerably,” Zandi wrote. The most likely scenario is that prices move “more-or-less sideways” for one to three years. That would “allow corporate earnings and rents to catch up and valuations to normalize at least partially.”
Write to Shaina Mishkin at shaina.mishkin@dowjones.com

by Calculated Risk on 3/26/2024 09:00:00 AM
S&P/Case-Shiller released the monthly Home Price Indices for January (“January” is a 3-month average of November, December and January closing prices).
This release includes prices for 20 individual cities, two composite indices (for 10 cities and 20 cities) and the monthly National index.
From S&P S&P CoreLogic Case-Shiller Index Continues to Trend Upward in January 2024
The S&P CoreLogic Case-Shiller U.S. National Home Price NSA Index, covering all nine U.S. census divisions, reported a 6.0% annual gain in January, up from a 5.6% rise in the previous month. The 10-
City Composite showed an increase of 7.4%, up from a 7.0% increase in the previous month. The 20-
City Composite posted a year-over-year increase of 6.6%, up from a 6.2% increase in the previous
month. San Diego again reported the highest year-over-year gain among the 20 cities with an 11.2%
increase in January, followed by Los Angeles, with an increase of 8.6%. Portland, though holding the
lowest rank after reporting the smallest year-over-year growth, retained an upward trend with a 0.9%
increase this month.
…
The U.S. National Index and the 20-City Composite showed a continued decrease of 0.1%, and 10-City
Composite remained unchanged in January.After seasonal adjustment, the U.S. National Index, the 20-City Composite, and the 10-City Composite
all posted month-over-month increases of 0.4%, 0.1%, and 0.2% respectively.“U.S. home prices continued their drive higher,” says Brian D. Luke, Head of Commodities, Real &
Digital Assets at S&P Dow Jones Indices. “Our National Composite rose by 6% in January, the fastest
annual rate since 2022. Stronger gains came from our 10- and 20-City Composite indices, rising 7.4%
and 6.6%, respectively. For the second consecutive month, all cities reported increases in annual
prices, with San Diego surging 11.2%. On a seasonal adjusted basis, home prices have continued to
break through previous all-time highs set last year”
emphasis added
 Click on graph for larger image.
The first graph shows the nominal seasonally adjusted Composite 10, Composite 20 and National indices (the Composite 20 was started in January 2000).
The Composite 10 index is up 0.2% in January (SA). The Composite 20 index is up 0.1% (SA) in January.
The National index is up 0.4% (SA) in January.
 The second graph shows the year-over-year change in all three indices.
The Composite 10 SA is up 7.4% year-over-year. The Composite 20 SA is up 6.6% year-over-year.
The National index SA is up 6.0% year-over-year.
Annual price changes were at expectations. I’ll have more later.
Home prices likely climbed in January, according to one closely watched measure. That trend will continue but gains will narrow by the end of the year, some economists say.
The S&P CoreLogic Case-Shiller Home Price index tracking changes in 20 of the nation’s large cities is expected to have been 6.6% higher in January than it was one year prior, according to FactSet consensus estimates. A seasonally adjusted index measuring month-to-month price gains is estimated to have risen 0.15% from December’s levels. The reading will be released Tuesday at 9 a.m.
A low supply of homes for sale, combined with a relatively easy comparison with prices at the same time last year, look set to keep prices strong. If the estimates are correct, January’s annual home price increase would be the largest since November 2022, according to December’s Case-Shiller data.
The median home in February sold for $384,500, up 5.7% from the same month in 2023, according to the National Association of Realtors—the greatest price increase in the trade group’s data set since October 2022.
data suggests prices have remained strong in March: over the four-week period ended March 17, home sale prices rose 5.3%.
Industry economists expect gains will slow later this year. The Mortgage Bankers Association estimates that home prices in the fourth quarter measured by the FHFA’s home price index will be 4.1% higher than one year prior—a slower growth rate than the anticipated 5.7% in the first quarter of this year.
expects its home price index to be 3.2% higher than one year prior at the end of the year, slower than an anticipated 7.2% first-quarter increase.
Advertisement – Scroll to Continue
That’s despite mortgage rates that remain higher than levels immediately before the pandemic. Higher rates and prices has made it harder for first-time buyers to enter the market. The share of buyers purchasing a previously owned home for the first time fell to 26% of all transactions in February from 28% the month prior, the National Association of Realtors said earlier this month.
Home values are stretched relative to their historic price-to-rent ratio, Mark Zandi, Moody’s Analytics’ chief economist, wrote in a Monday note. “That valuations have remained so high given the doubling in mortgage rates since just prior to the pandemic is especially surprising,” the economist wrote, adding that high home prices are supported by an undersupply of housing and the mortgage rate lock-in effect.
“For some semblance of normalcy to return to the housing market, something has to give—mortgage rates need to decline, incomes rise, and/or house prices cool considerably,” Zandi wrote. The most likely scenario is that prices move “more-or-less sideways” for one to three years. That would “allow corporate earnings and rents to catch up and valuations to normalize at least partially.”
Advertisement – Scroll to Continue
Write to Shaina Mishkin at shaina.mishkin@dowjones.com
Next week will see revised Q4 growth figures for the US and the UK. Usually, updated estimates aren’t much to write home about, and US figures will probably meet little fanfare. But in the UK, the revision could be crucial: when GDP contracted by 0.3 per cent in the final quarter of the year, it plunged the UK into a technical – albeit mild – recession.
When the margins are this fine, revisions can pack a punch, and a closer look at Office for National Statistics data reveals that revisions of 0.3 percentage points are not uncommon. This means that when improved data is released next Thursday, the current recession could be rendered even milder – or ‘revised away’ completely.
According to the Nationwide house price index, annual house price growth returned to positive territory for the first time in a year last month, with prices up 1.2 per cent. Yet the outlook remains uncertain. Swap rates (which underpin mortgage rates) have drifted upwards this year. Updated figures will be released on Friday.
Monday 25 March
Japan: Final leading index figures, corporate services
UK: CBI Distributive Trades survey
US: Building permits, Chicago Fed Index, new home sales, Dallas Fed Index
Tuesday 26 March
US: Core capital goods, durable goods orders, FHFA HPI, consumer confidence, Richmond Fed Index
Wednesday 27 March
Euro area: Business climate; consumer, economic, industrial and services confidence
Thursday 28 March
Euro area: M3 money supply
Japan: Trade balance, unemployment rate, industrial production, retail sales
UK: Current account, FDI, final Q4 GDP figures, government & household expenditure, business investment
US: Final Q4 GDP figures, Chicago PMI, final Michigan Sentiment data, pending home sales, Kansas City Fed Index
Friday 29 March
Japan: Constriction orders, housing starts
UK: Nationwide HPI
US: PCE inflation, core PCE inflation, personal consumption, personal income, wholesale inventories